写在前面
- 笔记是报班学习后整理的,适合温习,不适合新手。蹭着国庆长假整理了一份,希望对小伙伴有帮助.
- 生活加油,天天开心!博文主要围绕以几个方面:
- 监控的基本知识
- zabbix 的安装部署教程,
- 多节点监控实战
可能不是不喜欢了,而是累了,可能不是之前的喜欢都是假的,只是这个世界本来就很苍白
一、监控概述
1.1 监控的目的
| 监控的目的 | 描述 |
|---|---|
| 报告系统运行状况 | 每一部分必须同时监控,内容包括吞吐量、反应时间、使用率等 |
| 提前发现问题 | 进行服务器性能调整前,知道调整什么,找出系统的瓶颈在什么地方 |
1.1.1 监控的资源类别
| 监控的资源类别 | 描述 |
|---|---|
| 公开数据 | Web、FTP、SSH、数据库等应用服务,TCP或UDP端口 |
| 私有数据 | CPU、内存、磁盘、网卡流量等使用信息,用户、进程等运行信息 |
1.2 监控软件
| 命令 | 描述 |
|---|---|
ps | 查看进程信息 |
uptime | 查看CPU的负载 |
free | 查看系统内存信息 |
swapon -s | 查看交换分区信息 |
df -h | 查看文件系统挂载情况 |
ifconfg | 查看网卡信息 |
netstat或ss | 查看网络连接状态信息 (端口等) |
ping | 测试网络延迟 (是否可以通信) |
traceroute | 跟踪路由 |
iostat | 查询磁盘读写的性能 |
sar | 综合命令,可以查询cpu、磁盘、网络 , 查询历史或实时数据 |
查看进程信息
######查看进程信息
┌──[root@liruilongs.github.io]-[~]
└─$ ps -aux | less
┌──[root@liruilongs.github.io]-[~]
└─$
USER        PID %CPU %MEM    VSZ   RSS TTY      STAT START   TIME COMMAND
root          1  0.0  0.0  43264  3708 ?        Ss   17:49   0:04 /usr/lib/systemd/systemd --switched-root --system --deserialize 21
root          2  0.0  0.0      0     0 ?        S    17:49   0:00 [kthreadd]
root          3  0.0  0.0      0     0 ?        S    17:49   0:00 [ksoftirqd/0]
root          5  0.0  0.0      0     0 ?        S<   17:49   0:00 [kworker/0:0H]
root          7  0.0  0.0      0     0 ?        S    17:49   0:00 [migration/0]
root          8  0.0  0.0      0     0 ?        S    17:49   0:00 [rcu_bh]
root          9  0.0  0.0      0     0 ?        S    17:49   0:01 [rcu_sched]
root         10  0.0  0.0      0     0 ?        S    17:49   0:00 [watchdog/0]
root         11  0.0  0.0      0     0 ?        S    17:49   0:00 [watchdog/1]
root         12  0.0  0.0      0     0 ?        S    17:49   0:00 [migration/1]
root         13  0.0  0.0      0     0 ?        S    17:49   0:00 [ksoftirqd/1]
root         15  0.0  0.0      0     0 ?        S<   17:49   0:00 [kworker/1:0H]
root         17  0.0  0.0      0     0 ?        S    17:49   0:00 [kdevtmpfs]
root         18  0.0  0.0      0     0 ?        S<   17:49   0:00 [netns]
root         19  0.0  0.0      0     0 ?        S    17:49   0:00 [khungtaskd]
root         20  0.0  0.0      0     0 ?        S<   17:49   0:00 [writeback]
root         21  0.0  0.0      0     0 ?        S<   17:49   0:00 [kintegrityd]
root         22  0.0  0.0      0     0 ?        S<   17:49   0:00 [bioset]
root         23  0.0  0.0      0     0 ?        S<   17:49   0:00 [kblockd]
root         24  0.0  0.0      0     0 ?        S<   17:49   0:00 [md]
root         26  0.0  0.0      0     0 ?        R    17:49   0:02 [kworker/1:1]
root         31  0.0  0.0      0     0 ?        S    17:50   0:00 [kswapd0]
root         32  0.0  0.0      0     0 ?        SN   17:50   0:00 [ksmd]
root         33  0.0  0.0      0     0 ?        SN   17:50   0:00 [khugepaged]
root         34  0.0  0.0      0     0 ?        S<   17:50   0:00 [crypto]
root         42  0.0  0.0      0     0 ?        S<   17:50   0:00 [kthrotld]
root         44  0.0  0.0      0     0 ?        S<   17:50   0:00 [kmpath_rdacd]
:
查看cpu负载
#######查看cpu负载
┌──[root@liruilongs.github.io]-[~]
└─$ uptime
 19:09:58 up  1:20,  3 users,  load average: 0.00, 0.01, 0.05
查看内存使用信息
#######查看内存使用信息
┌──[root@liruilongs.github.io]-[~]
└─$ free -h
              total        used        free      shared  buff/cache   available
Mem:           3.8G        202M        3.3G         16M        322M        3.4G
Swap:            9G          0B          9G
查看交换分区设备信息
#######查看交换分区设备信息
┌──[root@liruilongs.github.io]-[~]
└─$ swapon -s
Filename                                Type            Size    Used    Priority
/dev/sda2                               partition       10485756        0       -1
查看设备文件系统挂载信息
#######查看设备文件系统挂载信息
┌──[root@liruilongs.github.io]-[~]
└─$ df -h
Filesystem      Size  Used Avail Use% Mounted on
/dev/sda1       150G  2.7G  148G   2% /
devtmpfs        2.0G     0  2.0G   0% /dev
tmpfs           2.0G     0  2.0G   0% /dev/shm
tmpfs           2.0G   17M  2.0G   1% /run
tmpfs           2.0G     0  2.0G   0% /sys/fs/cgroup
tmpfs           394M     0  394M   0% /run/user/0
┌──[root@liruilongs.github.io]-[~]
└─$
查看网卡信息, 需安装 net-tools软件包
########查看网卡信息, 需安装 net-tools软件包
#RX packets 指进站的总流量(从开机开始计算)
#TX packets 指出站的总流量(从开机开始计算)
┌──[root@liruilongs.github.io]-[~]
└─$ ifconfig ens32
ens32: flags=4163<UP,BROADCAST,RUNNING,MULTICAST>  mtu 1500
        inet 192.168.26.55  netmask 255.255.255.0  broadcast 192.168.26.255
        inet6 fe80::20c:29ff:fec9:6fae  prefixlen 64  scopeid 0x20<link>
        ether 00:0c:29:c9:6f:ae  txqueuelen 1000  (Ethernet)
        RX packets 754  bytes 72467 (70.7 KiB)
        RX errors 0  dropped 0  overruns 0  frame 0
        TX packets 562  bytes 64846 (63.3 KiB)
        TX errors 0  dropped 0 overruns 0  carrier 0  collisions 0

┌──[root@liruilongs.github.io]-[~]
└─$
查看端口信息和对应的协议,与grep结合使用
######查看端口信息和对应的协议,与grep结合使用
##netsat 功能相同
┌──[root@liruilongs.github.io]-[~]
└─$ ss -ntulpa
Netid  State      Recv-Q Send-Q                                      Local Address:Port                                                     Peer Address:Port
udp    UNCONN     0      0                                               127.0.0.1:323                                                                 *:*                   users:(("chronyd",pid=586,fd=1))
udp    UNCONN     0      0                                                     ::1:323                                                                :::*                   users:(("chronyd",pid=586,fd=2))
tcp    LISTEN     0      128                                                     *:22                                                                  *:*                   users:(("sshd",pid=935,fd=3))
tcp    LISTEN     0      100                                             127.0.0.1:25                                                                  *:*
 users:(("master",pid=1050,fd=13))
tcp    ESTAB      0      0                                           192.168.26.55:22                                                       192.168.26.1:2326
 users:(("sshd",pid=1203,fd=3))
tcp    ESTAB      0      0                                           192.168.26.55:22                                                       192.168.26.1:11634
 users:(("sshd",pid=12072,fd=3))
tcp    LISTEN     0      128                                                    :::22                                                                 :::*
 users:(("sshd",pid=935,fd=4))
tcp    LISTEN     0      100                                                   ::1:25                                                                 :::*
 users:(("master",pid=1050,fd=14))
┌──[root@liruilongs.github.io]-[~]
└─$
测试网络延迟 (是否可以通信)
#########测试网络延迟 (是否可以通信)
##time=0.519 ms 为网络延迟时间,时间越小,网络延迟越短
┌──[root@liruilongs.github.io]-[~]
└─$ ping 127.0.0.1
PING 127.0.0.1 (127.0.0.1) 56(84) bytes of data.
64 bytes from 127.0.0.1: icmp_seq=1 ttl=64 time=0.406 ms
64 bytes from 127.0.0.1: icmp_seq=2 ttl=64 time=0.090 ms
64 bytes from 127.0.0.1: icmp_seq=3 ttl=64 time=0.130 ms
64 bytes from 127.0.0.1: icmp_seq=4 ttl=64 time=0.124 ms
^C
--- 127.0.0.1 ping statistics ---
4 packets transmitted, 4 received, 0% packet loss, time 3005ms
rtt min/avg/max/mdev = 0.090/0.187/0.406/0.127 ms
┌──[root@liruilongs.github.io]-[~]
└─$
traceroute可以跟踪路由,查看到目标主机经过哪些路由
########traceroute可以跟踪路由,查看到目标主机经过哪些路由
[root@proxy ~]# yum -y install traceroute
[root@proxy ~]# traceroute 192.168.2.254
traceroute to 192.168.2.254 (192.168.2.254), 30 hops max, 60 byte packets
1 192.168.2.254 (192.168.2.254) 0.929 ms * *
iostat 查询磁盘的读写性能,需要安装软件包sysstat
########iostat 查询磁盘的读写性能,需要安装软件包sysstat
┌──[root@liruilongs.github.io]-[~]
└─$ iostat
Linux 3.10.0-693.el7.x86_64 (liruilongs.github.io)      09/30/2021      _x86_64_        (2 CPU)

avg-cpu:  %user   %nice %system %iowait  %steal   %idle
           0.16    0.01    0.18    0.11    0.00   99.54
##kB_read/s 磁盘每秒读的数据大小(KB)
##kB_wrtn/s 磁盘每秒写入的数据大小(KB)
##kB_read 磁盘读的总数据大小(KB)
##kB_wrtn 磁盘写入的总数据大小(KB)

Device:            tps    kB_read/s    kB_wrtn/s    kB_read    kB_wrtn
sda               1.59        59.74        11.22     360970      67798

┌──[root@liruilongs.github.io]-[~]
└─$
sar查看CPU的信息,第一个数字:指每隔几秒读取数据; 第二个数字: 指取几次CPU的数据
┌──[root@liruilongs.github.io]-[~]
└─$ sar 1 2
Linux 3.10.0-693.el7.x86_64 (liruilongs.github.io)      09/30/2021      _x86_64_        (2 CPU)
###%idle 指CPU的空闲率
08:59:07 PM     CPU     %user     %nice   %system   %iowait    %steal     %idle
08:59:08 PM     all      0.00      0.00      0.00      0.00      0.00    100.00
08:59:09 PM     all      0.00      0.00      0.00      0.00      0.00    100.00
Average:        all      0.00      0.00      0.00      0.00      0.00    100.00
┌──[root@liruilongs.github.io]-[~]
└─$
使用sar查看所有网卡的实时流量信息
┌──[root@liruilongs.github.io]-[~]
└─$  sar -n DEV 1 2
#############使用sar查看所有网卡的实时流量信息
#第一个数字1:指每隔1秒查看一次网络数据流量; 第二个数字2: 指查看两次
Linux 3.10.0-693.el7.x86_64 (liruilongs.github.io)      09/30/2021      _x86_64_        (2 CPU)

#rxkB/s 指每秒接收数据的流量(KB);
#txkB/s 指每秒发送数据的流量 (KB);
09:00:26 PM     IFACE   rxpck/s   txpck/s    rxkB/s    txkB/s   rxcmp/s   txcmp/s  rxmcst/s
09:00:27 PM     ens32      0.00      0.00      0.00      0.00      0.00      0.00      0.00
09:00:27 PM        lo      0.00      0.00      0.00      0.00      0.00      0.00      0.00
09:00:27 PM   docker0      0.00      0.00      0.00      0.00      0.00      0.00      0.00

09:00:27 PM     IFACE   rxpck/s   txpck/s    rxkB/s    txkB/s   rxcmp/s   txcmp/s  rxmcst/s
09:00:28 PM     ens32      1.00      1.00      0.06      0.47      0.00      0.00      0.00
09:00:28 PM        lo      0.00      0.00      0.00      0.00      0.00      0.00      0.00
09:00:28 PM   docker0      0.00      0.00      0.00      0.00      0.00      0.00      0.00

Average:        IFACE   rxpck/s   txpck/s    rxkB/s    txkB/s   rxcmp/s   txcmp/s  rxmcst/s
Average:        ens32      0.50      0.50      0.03      0.23      0.00      0.00      0.00
Average:           lo      0.00      0.00      0.00      0.00      0.00      0.00      0.00
Average:      docker0      0.00      0.00      0.00      0.00      0.00      0.00      0.00
┌──[root@liruilongs.github.io]-[~]
└─$
1.3 自动化监控系统
| Cacti | 特点:将监控到的数据,绘制成各种图形 | 基于SNMP协议 (网络管理协议) 的监控软件,强大的绘图能力 |
| Nagios | 特点:状态检查和报警机制 (例如:内存不足或CPU负载高时,及时的给管理员发送报警信息(邮件报警,短信报警等) ) | 基于Agent监控,强大的状态检查与报警机制,插件极多,自己写监控脚本嵌入到Nagios非常方便 |
| Zabbix | 特点:支持多种报警机制,支持分布式监控,支持数据绘图 | 基于多种监控机制,支持分布式监控 |
1.3.1 Zabbix简介
Zabbix 是一个高度集成的监控解决方案,可以实现企业级的开源分布式监控,
Zabbix 通过 C/S模式采集监控数据
C/S (client/server):客户端/服务器
客户端程序负载采集要监控的数据,然后发送给监控服务器;
监控服务器对客户发送过来的数据进行存储和处理;
Zabbix通过B/S模式实现Web管理
B/S (browser/server): 浏览器/服务器
管理员可以通过浏览器,访问监控服务器web页面,并可以查看和管理监控系统
1.3.2 监控拓扑

| Zabbix监控原理: |
|---|
| 部署一个Zabbix监控服务器, 用于存储和处理监控数据; |
| 如果被监控的是Linux或Windows主机,需要安装客户端程序agent来采集监控数据; |
| 如果被监控的是网络设备(交换机,路由器等),通过SNMP协议进行监控; |
| 最后Zabbix监控服务器,将客户端收集来的数据存储到数据库中,通过web页面来管理 |
| 监控角色 |
|---|
| 监控服务器 |
| 监控服务器可以通过SNMP (网络管理协议)或Agent采集数据 |
| 数据可以写入MYSQL、Oracle等数据库中 |
| 服务器使用LNMP实现web前端的管理 |
| 被监控主机 |
| 被监控主机需要安装Agent |
| 常见的网络设备一般支持SNMP (网络管理协议) |
二、LNMP环境准备
这里的话,因为zabbix web系统使用的是php,所以需要配置LNMP环境。
Nginx是一款小巧而高效的Web服务器软件,可帮您在Linux系统下快速方便地搭建出LNMP Web服务环境。在ECS实例上搭建LNMP环境,其中LNMP分别代表Linux、Nginx、MySQL和PHP。
2.1 部署LNMP
这里小伙伴可以参考这个:手动部署LNMP环境(CentOS 7)
2.1.1 安装前准备
- 监控服务器(需要使用Web页面操作,因此需要先部署LNMP)
- 设置主机名(zabbixserver)
- 设置IP地址(192.168.26.15)
- 关闭防火墙、SELinux
- 监控客户端 (2.100和2.200)
- 主机web1(192.168.26.14)
- 主机web2(192.168.26.13)
- 关闭防火墙、SELinux
虚拟机环境准备(克隆centos7 模板机): ——> 关闭防火墙和SELinux,嗯,因为需要多个机器,所以我们用
ansible,方便一点,这里,192.168.26.15为控制机,192.168.26.14,192.168.26.13 为节点机
| 主机名 | IP地址 |
|---|---|
| zabbixserver | 192.168.26.15 |
| web1 | 192.168.26.14 |
| web2 | 192.168.26.13 |
配置到物理机的SSH免密
┌──(liruilong㉿Liruilong)-[/mnt/e/docker]
└─$ ssh-copy-id root@192.168.26.13
/usr/bin/ssh-copy-id: INFO: Source of key(s) to be installed: "/home/liruilong/.ssh/id_rsa.pub"
The authenticity of host '192.168.26.13 (192.168.26.13)' can't be established.
ECDSA key fingerprint is SHA256:1F/T20FjhEaLDtutI1rXCwOFGZ5nPs3hFzHyjsnAs3Q.
Are you sure you want to continue connecting (yes/no/[fingerprint])? yes
/usr/bin/ssh-copy-id: INFO: attempting to log in with the new key(s), to filter out any that are already installed
/usr/bin/ssh-copy-id: INFO: 1 key(s) remain to be installed -- if you are prompted now it is to install the new keys
root@192.168.26.13's password:

Number of key(s) added: 1

Now try logging into the machine, with:   "ssh 'root@192.168.26.13'"
and check to make sure that only the key(s) you wanted were added.


┌──(liruilong㉿Liruilong)-[/mnt/e/docker]
└─$ ssh-copy-id root@192.168.26.14
/usr/bin/ssh-copy-id: INFO: Source of key(s) to be installed: "/home/liruilong/.ssh/id_rsa.pub"
The authenticity of host '192.168.26.14 (192.168.26.14)' can't be established.
ECDSA key fingerprint is SHA256:cfpb8zAi+otnaU0YIoRb76iaOYiFDI4JHyU9N0LmNkY.
Are you sure you want to continue connecting (yes/no/[fingerprint])? yes
/usr/bin/ssh-copy-id: INFO: attempting to log in with the new key(s), to filter out any that are already installed
/usr/bin/ssh-copy-id: INFO: 1 key(s) remain to be installed -- if you are prompted now it is to install the new keys
root@192.168.26.14's password:

Number of key(s) added: 1

Now try logging into the machine, with:   "ssh 'root@192.168.26.14'"
and check to make sure that only the key(s) you wanted were added.


┌──(liruilong㉿Liruilong)-[/mnt/e/docker]
└─$ ssh-copy-id root@192.168.26.15
/usr/bin/ssh-copy-id: INFO: Source of key(s) to be installed: "/home/liruilong/.ssh/id_rsa.pub"
The authenticity of host '192.168.26.15 (192.168.26.15)' can't be established.
ECDSA key fingerprint is SHA256:Ix6WxiXXJVdMFdSqiXLaPYdg+khbzkjuYO4raDDnih0.
Are you sure you want to continue connecting (yes/no/[fingerprint])? yes
/usr/bin/ssh-copy-id: INFO: attempting to log in with the new key(s), to filter out any that are already installed
/usr/bin/ssh-copy-id: INFO: 1 key(s) remain to be installed -- if you are prompted now it is to install the new keys
root@192.168.26.15's password:

Number of key(s) added: 1

Now try logging into the machine, with:   "ssh 'root@192.168.26.15'"
and check to make sure that only the key(s) you wanted were added.


┌──(liruilong㉿Liruilong)-[/mnt/e/docker]
└─$
ansible环境准备
┌──[root@zabbixserver]-[/]
└─$ mkdir ansible;cd ansible;vim ansible.cfg
┌──[root@zabbixserver]-[/ansible]
└─$  cat ansible.cfg
[defaults]
# 主机清单文件,就是要控制的主机列表
inventory=inventory
# 连接受管机器的远程的用户名
remote_user=root
# 角色目录
roles_path=roles
# 设置用户的su 提权
[privilege_escalation]
become=True
become_method=sudo
become_user=root
become_ask_pass=False

┌──[root@zabbixserver]-[/ansible]
└─$ vim inventory
┌──[root@zabbixserver]-[/ansible]
└─$ cat inventory
[web]
192.168.26.13
192.168.26.14

[zabbix]
192.168.26.13
192.168.26.14
127.0.0.1
┌──[root@zabbixserver]-[/ansible]
└─$
配置控制机到节点机的SSH免密
┌──[root@zabbixserver]-[/ansible]
└─$ ssh-copy-id root@192.168.26.13

/usr/bin/ssh-copy-id: ERROR: failed to open ID file '/root/.pub': No such file or directory
        (to install the contents of '/root/.pub' anyway, look at the -f option)
┌──[root@zabbixserver]-[/ansible]
└─$ ssh-copy-id root@192.168.26.14

/usr/bin/ssh-copy-id: ERROR: failed to open ID file '/root/.pub': No such file or directory
        (to install the contents of '/root/.pub' anyway, look at the -f option)
┌──[root@zabbixserver]-[/ansible]
└─$ ssh-keygen
Generating public/private rsa key pair.
Enter file in which to save the key (/root/.ssh/id_rsa):
Enter passphrase (empty for no passphrase):
Enter same passphrase again:
Your identification has been saved in /root/.ssh/id_rsa.
Your public key has been saved in /root/.ssh/id_rsa.pub.
The key fingerprint is:
SHA256:/wLemqRJd5tsIWj/hxole6EpNTZ9M2lDooVGnYTx3I4 root@zabbixserver
The key's randomart image is:
+---[RSA 2048]----+
|        o=..     |
|       ..+o.     |
|        o = o    |
|       . + = .   |
|       .S E O    |
|      oooX.+ +   |
|     .ooB++o     |
|     . *o*=+.    |
|      o +==o.    |
+----[SHA256]-----+
┌──[root@zabbixserver]-[/ansible]
└─$ ssh-copy-id root@192.168.26.14
/usr/bin/ssh-copy-id: INFO: Source of key(s) to be installed: "/root/.ssh/id_rsa.pub"
The authenticity of host '192.168.26.14 (192.168.26.14)' can't be established.
ECDSA key fingerprint is SHA256:cfpb8zAi+otnaU0YIoRb76iaOYiFDI4JHyU9N0LmNkY.
ECDSA key fingerprint is MD5:35:32:02:28:b3:2f:9b:11:3c:d9:16:29:ab:2f:75:73.
Are you sure you want to continue connecting (yes/no)? yes
/usr/bin/ssh-copy-id: INFO: attempting to log in with the new key(s), to filter out any that are already installed
/usr/bin/ssh-copy-id: INFO: 1 key(s) remain to be installed -- if you are prompted now it is to install the new keys
root@192.168.26.14's password:

Number of key(s) added: 1

Now try logging into the machine, with:   "ssh 'root@192.168.26.14'"
and check to make sure that only the key(s) you wanted were added.

┌──[root@zabbixserver]-[/ansible]
└─$ ssh-copy-id root@192.168.26.13
/usr/bin/ssh-copy-id: INFO: Source of key(s) to be installed: "/root/.ssh/id_rsa.pub"
The authenticity of host '192.168.26.13 (192.168.26.13)' can't be established.
ECDSA key fingerprint is SHA256:1F/T20FjhEaLDtutI1rXCwOFGZ5nPs3hFzHyjsnAs3Q.
ECDSA key fingerprint is MD5:b3:c9:31:0e:08:31:5b:7b:25:dd:a3:a7:f1:db:ac:7a.
Are you sure you want to continue connecting (yes/no)? yes
/usr/bin/ssh-copy-id: INFO: attempting to log in with the new key(s), to filter out any that are already installed
/usr/bin/ssh-copy-id: INFO: 1 key(s) remain to be installed -- if you are prompted now it is to install the new keys
root@192.168.26.13's password:

Number of key(s) added: 1

Now try logging into the machine, with:   "ssh 'root@192.168.26.13'"
and check to make sure that only the key(s) you wanted were added.

┌──[root@zabbixserver]-[/ansible]
└─$ ssh-copy-id root@192.168.26.15
/usr/bin/ssh-copy-id: INFO: Source of key(s) to be installed: "/root/.ssh/id_rsa.pub"
/usr/bin/ssh-copy-id: INFO: attempting to log in with the new key(s), to filter out any that are already installed
/usr/bin/ssh-copy-id: INFO: 1 key(s) remain to be installed -- if you are prompted now it is to install the new keys
root@192.168.26.15's password:

Number of key(s) added: 1

Now try logging into the machine, with:   "ssh 'root@192.168.26.15'"
and check to make sure that only the key(s) you wanted were added.

┌──[root@zabbixserver]-[/ansible]
测试ansible
┌──[root@zabbixserver]-[/ansible]
└─$ ansible all -m ping
192.168.26.13 | SUCCESS => {
    "ansible_facts": {
        "discovered_interpreter_python": "/usr/bin/python"
    },
    "changed": false,
    "ping": "pong"
}
192.168.26.14 | SUCCESS => {
    "ansible_facts": {
        "discovered_interpreter_python": "/usr/bin/python"
    },
    "changed": false,
    "ping": "pong"
}
127.0.0.1 | SUCCESS => {
    "ansible_facts": {
        "discovered_interpreter_python": "/usr/bin/python"
    },
    "changed": false,
    "ping": "pong"
}
┌──[root@zabbixserver]-[/ansible]
└─$
检查防火墙和selinux
┌──[root@zabbixserver]-[/ansible]
└─$ ansible all -m shell -a 'sed  -n 7p  /etc/selinux/config'
[WARNING]: Consider using the replace, lineinfile or template module rather than running 'sed'.  If
you need to use command because replace, lineinfile or template is insufficient you can add 'warn:
false' to this command task or set 'command_warnings=False' in ansible.cfg to get rid of this
message.
127.0.0.1 | CHANGED | rc=0 >>
SELINUX=disabled
192.168.26.14 | CHANGED | rc=0 >>
SELINUX=disabled
192.168.26.13 | CHANGED | rc=0 >>
SELINUX=disabled
┌──[root@zabbixserver]-[/ansible]
└─$ ansible all -m shell -a ' systemctl status firewalld | grep Active'
127.0.0.1 | CHANGED | rc=0 >>
   Active: active (running) since Fri 2021-10-01 17:48:56 CST; 51min ago
192.168.26.14 | CHANGED | rc=0 >>
   Active: active (running) since Fri 2021-10-01 17:49:47 CST; 50min ago
192.168.26.13 | CHANGED | rc=0 >>
   Active: active (running) since Fri 2021-10-01 17:49:14 CST; 51min ago
发现防火墙还没有关闭,所以在关闭一下防火墙:
┌──[root@zabbixserver]-[/ansible]
└─$ ansible all -m shell -a 'systemctl disable firewalld --now'
192.168.26.14 | CHANGED | rc=0 >>
Removed symlink /etc/systemd/system/multi-user.target.wants/firewalld.service.
Removed symlink /etc/systemd/system/dbus-org.fedoraproject.FirewallD1.service.
192.168.26.13 | CHANGED | rc=0 >>
Removed symlink /etc/systemd/system/multi-user.target.wants/firewalld.service.
Removed symlink /etc/systemd/system/dbus-org.fedoraproject.FirewallD1.service.
127.0.0.1 | CHANGED | rc=0 >>
Removed symlink /etc/systemd/system/multi-user.target.wants/firewalld.service.
Removed symlink /etc/systemd/system/dbus-org.fedoraproject.FirewallD1.service.
┌──[root@zabbixserver]-[/ansible]
└─$
2.1.2 部署LNMP
┌──[root@zabbixserver]-[/ansible]
└─$ yum -y install  nginx php php-fpm php-mysql mariadb-server mariadb mariadb-devel
安装需要的软件包,也可以分别安装
##安装Ng
[root@zabbixserver ~]yum -y install nginx
###安装php解释器及相关软件包
[root@zabbixserver ~]# yum -y install php #php解释器
[root@zabbixserver ~]# yum -y install php-fpm #可以支持 Fastcgi 通用语言
[root@zabbixserver ~]# yum -y install php-mysql #php和数据通信的扩展包
###安装数据库及相关软件包
[root@web1 ~]# yum -y install mariadb-server #数据库服务端软件
[root@web1 ~]# yum -y install mariadb #数据库客户端软件
[root@web1 ~]# yum -y install mariadb-devel #相关的依赖包
修改nginx配置
┌──[root@zabbixserver]-[~]
└─$ vim /etc/nginx/nginx.conf
┌──[root@zabbixserver]-[~]
└─$ cat /etc/nginx/nginx.conf
# For more information on configuration, see:
#   * Official English Documentation: http://nginx.org/en/docs/
#   * Official Russian Documentation: http://nginx.org/ru/docs/

user nginx;
worker_processes auto;
error_log /var/log/nginx/error.log;
pid /run/nginx.pid;

# Load dynamic modules. See /usr/share/doc/nginx/README.dynamic.
include /usr/share/nginx/modules/*.conf;

events {
    worker_connections 1024;
}

http {
    log_format  main  '$remote_addr - $remote_user [$time_local] "$request" '
                      '$status $body_bytes_sent "$http_referer" '
                      '"$http_user_agent" "$http_x_forwarded_for"';

    access_log  /var/log/nginx/access.log  main;

    sendfile            on;
    tcp_nopush          on;
    tcp_nodelay         on;
    keepalive_timeout   65;
    types_hash_max_size 4096;

    include             /etc/nginx/mime.types;
    default_type        application/octet-stream;

    # Load modular configuration files from the /etc/nginx/conf.d directory.
    # See http://nginx.org/en/docs/ngx_core_module.html#include
    # for more information.
    include /etc/nginx/conf.d/*.conf;

    server {
        listen       80;
        listen       [::]:80;
        server_name  _;
        root         /usr/share/nginx/html;

        # Load configuration files for the default server block.
        include /etc/nginx/default.d/*.conf;

        error_page 404 /404.html;
        location = /404.html {
        }

        error_page 500 502 503 504 /50x.html;
        location = /50x.html {

        }
fastcgi_buffers 8 16k; #缓存php生成的数据,缓存大小为8个16k
fastcgi_buffer_size 32k; #缓存php产生的头部信息,缓存大小为32k
fastcgi_connect_timeout 300; #连接php的超时时间为300秒
fastcgi_send_timeout 300; #发送请求的超时时间为300秒
fastcgi_read_timeout 300; #读取请求的超时时间为300秒
location ~ \.php$ {
          root    html;
          fastcgi_pass   127.0.0.1:9000;
          fastcgi_index  index.php;
          include        fastcgi.conf;

        }
       # location ~ \.php$ {
       # root           html;
       # fastcgi_pass   127.0.0.1: 9000;
       # fastcgi_index  index.php;
        #fastcgi_param  SCRIPT_FILENAME  /scripts$fastcgi_script_name;
       # include        fastcgi_params;

        #}
    }

# Settings for a TLS enabled server.
#
#    server {
#        listen       443 ssl http2;
#        listen       [::]:443 ssl http2;
#        server_name  _;
#        root         /usr/share/nginx/html;
#
#        ssl_certificate "/etc/pki/nginx/server.crt";
#        ssl_certificate_key "/etc/pki/nginx/private/server.key";
#        ssl_session_cache shared:SSL:1m;
#        ssl_session_timeout  10m;
#        ssl_ciphers HIGH:!aNULL:!MD5;
#        ssl_prefer_server_ciphers on;
#
#        # Load configuration files for the default server block.
#        include /etc/nginx/default.d/*.conf;
#
#        error_page 404 /404.html;
#            location = /40x.html {
#        }
#
#        error_page 500 502 503 504 /50x.html;
#            location = /50x.html {
#        }
#    }

}
通过systemd的方式管理nginx服务,通过源码安装的NG需要
##此文件,每次Linux开机时,都会运行里面的所有命令
[root@zabbixserver ~]# vim /etc/rc.d/rc.local
/usr/local/nginx/sbin/nginx
[root@zabbixserver ~]# chmod +x /etc/rc.d/rc.local
####nginx管理服务模板文件路径,也可在百度搜索nginx systemd
https://www.nginx.com/resources/wiki/start/topics/examples/systemd/
#####在/usr/lib/systemcd/systemd下创建nginx服务配置文件
##拷贝模板
[root@web1 ~]# vim /usr/lib/systemd/system/nginx.service
[Unit]
Description=The NGINX HTTP server #描述信息
##After 指nginx开机时,启动服务的顺序
After=syslog.target network-online.targetnss-lookup.target
[Service]
#Type 指启动服务后只有一个进程使用simple,有多个进程使用forking
Type=forking
PIDFile=/usr/local/nginx/logs/nginx.pid
####修改路径为/usr/local/nginx/sbin 实际nginx安装路径
##ExecStartPre 指启动服务之前检测nginx配置语法是否正确
ExecStartPre=/usr/local/nginx/sbin/nginx -t
ExecStart=/usr/local/nginx/sbin/nginx #启动nginx服务
ExecReload=/usr/local/nginx/sbin/ -s reload #重启nginx服务
ExecStop=/bin/kill -s QUIT $MAINPID #停止nginx服务
PrivateTmp=true
[Install]
#WantedBy 指将nginx服务放到 multi-user.target 服务组
#路径在/etc/systemd/system/multi-user.target
#重启multi-user.target,会启动这个目录下的所有服务
WantedBy=multi-user.target
2.1.4 启动服务
┌──[root@zabbixserver]-[~]
└─$ systemctl enable mariadb.service --now
Created symlink from /etc/systemd/system/multi-user.target.wants/mariadb.service to /usr/lib/systemd/system/mariadb.service.
┌──[root@zabbixserver]-[~]
└─$ systemctl enable php-fpm --now
Created symlink from /etc/systemd/system/multi-user.target.wants/php-fpm.service to /usr/lib/systemd/system/php-fpm.service.
┌──[root@zabbixserver]-[~]
└─$ systemctl enable nginx  --now
Created symlink from /etc/systemd/system/multi-user.target.wants/nginx.service to /usr/lib/systemd/system/nginx.service.
┌──[root@zabbixserver]-[~]
└─$
页面测试
######编写php动态测试页面
[root@zabbixserver ~]# vim /usr/local/nginx/html/test.php
<?php
$i=33;
echo $i;
?>

三、安装Zabbix
官方文档: 从部署包安装
3.1 部署Zabbix监控端服务器
3.1.1 安装软件
┌──[root@zabbixserver]-[~]
└─$ ls
anaconda-ks.cfg  calico.yaml  one-client-install.sh  zabbix-3.4.4
calico_3_14.tar  download     set.sh                 zabbix-3.4.4.tar.gz
##########安装zabbix相关依赖包
┌──[root@zabbixserver]-[~]
└─$ yum -y install net-snmp-devel curl-devel libevent-devel gcc
##########获取mysql_config的绝对路径 (此命令用于编译mysql的客户端程序)
┌──[root@zabbixserver]-[~]
└─$ mysql_config
Usage: /usr/bin/mysql_config [OPTIONS]
Options:
        --cflags         [-I/usr/include/mysql]
        --include        [-I/usr/include/mysql]
        --libs           [-L/usr/lib64/mysql -lmysqlclient -lpthread -lz -lm -ldl -lssl -lcrypto]
        --libs_r         [-L/usr/lib64/mysql -lmysqlclient -lpthread -lz -lm -ldl -lssl -lcrypto]
        --plugindir      [/usr/lib64/mysql/plugin]
        --socket         [/var/lib/mysql/mysql.sock]
        --port           [0]
        --version        [5.5.68]
        --libmysqld-libs [-L/usr/lib64/mysql -lmysqld]
        --variable=VAR   VAR is one of:
                pkgincludedir [/usr/include/mysql]
                pkglibdir     [/usr/lib64/mysql]
                plugindir     [/usr/lib64/mysql/plugin]
源码安装zabbix软件
#########进入到zabbix源码包下,源码安装zabbix软件
#--enable-server 指安装zabbix服务端模块;
#--enable-agent 指安装zabbix客户端模块(用于收集监控数据,在客户端安装,服务器也可以按照,用于监控自己);
#--enable-proxy 指安装zabbix的代理模块,实现代理功能(此实验用不到);
#--with-mysql= 指定mysql数据库,用于存放客户端收集的监控数据;
#--with-net-snmp 指安装此模块,可以通过snmp协议,去监控网络设备(路由器,交换机);
#--with-libcurl 指安装此模块,可以让zabbix调用curl,获取被监控主机的信息,做健康检查
┌──[root@zabbixserver]-[~]
└─$ cd zabbix-3.4.4/
┌──[root@zabbixserver]-[~/zabbix-3.4.4]
└─$ ls
aclocal.m4  ChangeLog     config.sub    database   INSTALL      Makefile.in  NEWS        src
AUTHORS     compile       configure     depcomp    install-sh   man          README      upgrades
bin         conf          configure.ac  frontends  m4           misc         README.txt
build       config.guess  COPYING       include    Makefile.am  missing      sass
┌──[root@zabbixserver]-[~/zabbix-3.4.4]
└─$  ./configure  --enable-server --enable-proxy --enable-agent  --with-mysql=/usr/bin/mysql_config
#########直接安装,不需要make
┌──[root@zabbixserver]-[~/zabbix-3.4.4]
└─$ make install
查看zabbix相关的配置文件
#########查看zabbix相关的配置文件
#zabbix_server.conf zabbix服务端配置文件
#zabbix_agentd.conf zabbix客户端配置文件
#zabbix_proxy.conf zabbix监控代理的配置文件
┌──[root@zabbixserver]-[~/zabbix-3.4.4]
└─$ ls /usr/local/etc/
zabbix_agentd.conf    zabbix_proxy.conf    zabbix_server.conf
zabbix_agentd.conf.d  zabbix_proxy.conf.d  zabbix_server.conf.d
┌──[root@zabbixserver]-[~/zabbix-3.4.4]
└─$
获取目标主机监控数据和向目标主机发送监控数据的命令
#########获取目标主机监控数据和向目标主机发送监控数据的命令
#zabbix_get 获取监控数据的命令
#zabbix_sender 发送监控数据的命令
┌──[root@zabbixserver]-[~/zabbix-3.4.4]
└─$ ls /usr/local/bin/
zabbix_get  zabbix_sender
启动zabbix的命令,zabbix默认无法通过systemd管理
########启动zabbix的命令,zabbix默认无法通过systemd管理
#zabbix_agentd zabbix 客户端的启动命令
#zabbix_proxy zabbix 监控代理服务的启动命令
#zabbix_server zabbix 服务端的启动命令
┌──[root@zabbixserver]-[~/zabbix-3.4.4]
└─$ ls /usr/local/sbin/
zabbix_agentd  zabbix_proxy  zabbix_server
┌──[root@zabbixserver]-[~/zabbix-3.4.4]
└─$
3.1.2初始化准备
创建数据库与数据库账户
###########创建zabbix数据库并授权
[root@zabbixserver ~]# mysql
#创建一个zabbix空数据库,用于存储监控数据,设置为utf8格式,可以存储中文
MariaDB [(none)]> create database zabbix character set utf8;
#授权,zabbix用户可以从本机登录mysql
#登录密码为zabbix,对zabbix库下的表拥有所有权限(增删改查)
MariaDB [(none)]> grant all on zabbix.* to zabbix@'localhost' identified by 'zabbix';
#退出数据库
MariaDB [(none)]> exit
导入zabbix提供的备份数据库文件,导入顺序不能发生改变(否则报错)
#########导入zabbix提供的备份数据库文件,导入顺序不能发生改变(否则报错)
##mysql备份数据库文件在zabbix源码包路径:zabbix-3.4.4/database/mysql/
#Oracle备份数据库文件在zabbix源码包路径:zabbix-3.4.4/database/oracle/
┌──[root@zabbixserver]-[~/zabbix-3.4.4]
└─$ ls
aclocal.m4  compile        config.sub    depcomp     m4           misc        sass
AUTHORS     conf           configure     frontends   Makefile     missing     src
bin         config.guess   configure.ac  include     Makefile.am  NEWS        upgrades
build       config.log     COPYING       INSTALL     Makefile.in  README
ChangeLog   config.status  database      install-sh  man          README.txt
┌──[root@zabbixserver]-[~/zabbix-3.4.4]
└─$ cd database/mysql/
┌──[root@zabbixserver]-[~/zabbix-3.4.4/database/mysql]
└─$ ls
data.sql  images.sql  schema.sql
┌──[root@zabbixserver]-[~/zabbix-3.4.4/database/mysql]
└─$ mysql -uzabbix -pzabbix zabbix < schema.sql
┌──[root@zabbixserver]-[~/zabbix-3.4.4/database/mysql]
└─$ mysql -uzabbix -pzabbix zabbix < images.sql
┌──[root@zabbixserver]-[~/zabbix-3.4.4/database/mysql]
└─$  mysql -uzabbix -pzabbix zabbix < data.sql
┌──[root@zabbixserver]-[~/zabbix-3.4.4/database/mysql]
└─$
查看mysql的zabbix下的表
┌──[root@zabbixserver]-[~/zabbix-3.4.4/database/mysql]
└─$ mysql
Welcome to the MariaDB monitor.  Commands end with ; or \g.
Your MariaDB connection id is 6
Server version: 5.5.68-MariaDB MariaDB Server

Copyright (c) 2000, 2018, Oracle, MariaDB Corporation Ab and others.

Type 'help;' or '\h' for help. Type '\c' to clear the current input statement.

MariaDB [(none)]> use zabbix;
Reading table information for completion of table and column names
You can turn off this feature to get a quicker startup with -A

Database changed
MariaDB [zabbix]> show tables;
+----------------------------+
| Tables_in_zabbix           |
+----------------------------+
| acknowledges               |
| actions                    |
| alerts                     |
| application_discovery      |
| application_prototype      |
| application_template       |
| applications               |
。。。。。
| widget                     |
| widget_field               |
+----------------------------+
140 rows in set (0.00 sec)
#查看zabbix用户名和密码
MariaDB [zabbix]> select alias,passwd from users;
+-------+----------------------------------+
| alias | passwd                           |
+-------+----------------------------------+
| Admin | 5fce1b3e34b520afeffb37ce08c7cd66 |
| guest | d41d8cd98f00b204e9800998ecf8427e |
+-------+----------------------------------+
2 rows in set (0.00 sec)

MariaDB [zabbix]> exit
Bye
┌──[root@zabbixserver]-[~/zabbix-3.4.4/database/mysql]
└─$
上线Zabbix页面
┌──[root@zabbixserver]-[~/zabbix-3.4.4]
└─$ cd frontends/php/
#拷贝所有内容到nginx网页的默认路径下
┌──[root@zabbixserver]-[~/zabbix-3.4.4/frontends/php]
└─$ cp -r * /usr/share/nginx/html
cp: cannot overwrite non-directory ‘/usr/share/nginx/html/img’ with directory ‘img’
┌──[root@zabbixserver]-[~/zabbix-3.4.4/frontends/php]
└─$ cd /usr/share/nginx/html/
┌──[root@zabbixserver]-[/usr/share/nginx/html]
└─$ chown -R nginx.nginx /usr/share/nginx/html/
┌──[root@zabbixserver]-[/usr/share/nginx/html]
└─$
安装依赖软件
┌──[root@zabbixserver]-[~/zabbix-3.4.4/frontends/php]
└─$ yum -y install php-gd php-xml php-ldap;yum -y install php-bcmath php-mbstring
Loaded plugins: fastestmirror
Loading mirror speeds from cached hostfile
Package php-gd-5.4.16-48.el7.x86_64 already installed and latest version
Package php-xml-5.4.16-48.el7.x86_64 already installed and latest version
Package php-ldap-5.4.16-48.el7.x86_64 already installed and latest version
Nothing to do
Loaded plugins: fastestmirror
Loading mirror speeds from cached hostfile
Package php-bcmath-5.4.16-48.el7.x86_64 already installed and latest version
Package php-mbstring-5.4.16-48.el7.x86_64 already installed and latest version
Nothing to do
┌──[root@zabbixserver]-[~/zabbix-3.4.4/frontends/php]
└─$
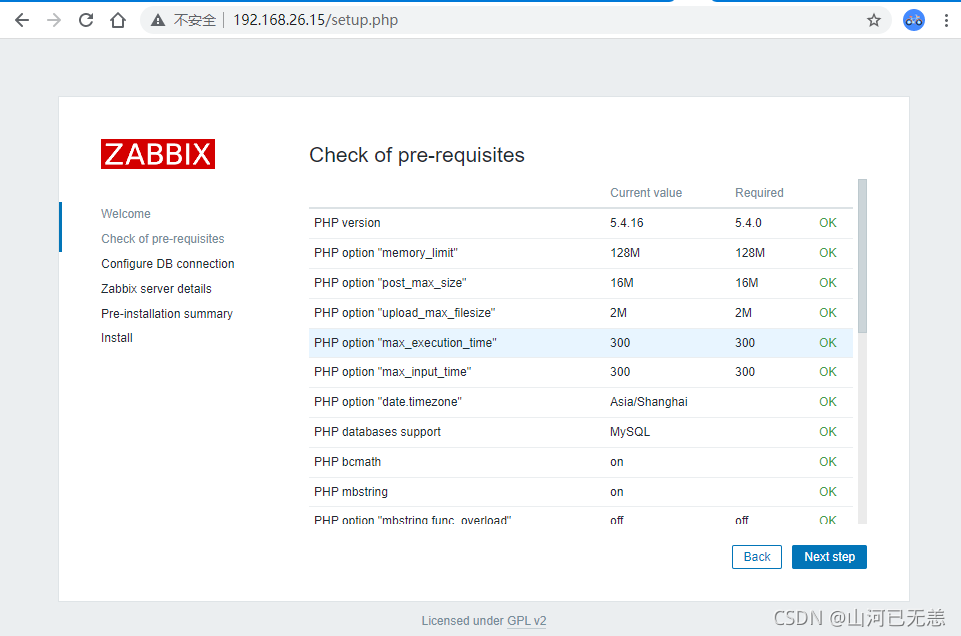
修改PHP配置文件
######php中,分号【;】 代表注释
┌──[root@zabbixserver]-[~/zabbix-3.4.4/frontends/php]
└─$  vim /etc/php.inii
......
#每个php脚本可最大以执行的时间
384 max_execution_time = 300
......
#服务器接收数据的时间限制为300s
394 max_input_time = 300
......
#客户端连接时,最多可以接受多大的POST请求数据
672 post_max_size = 32M
......
#设置时区
878 date.timezone = Asia/Shanghai
......
重启php-fpm服务
#########重启php-fpm服务
[root@zabbixserver ~]# systemctl restart php-fpm
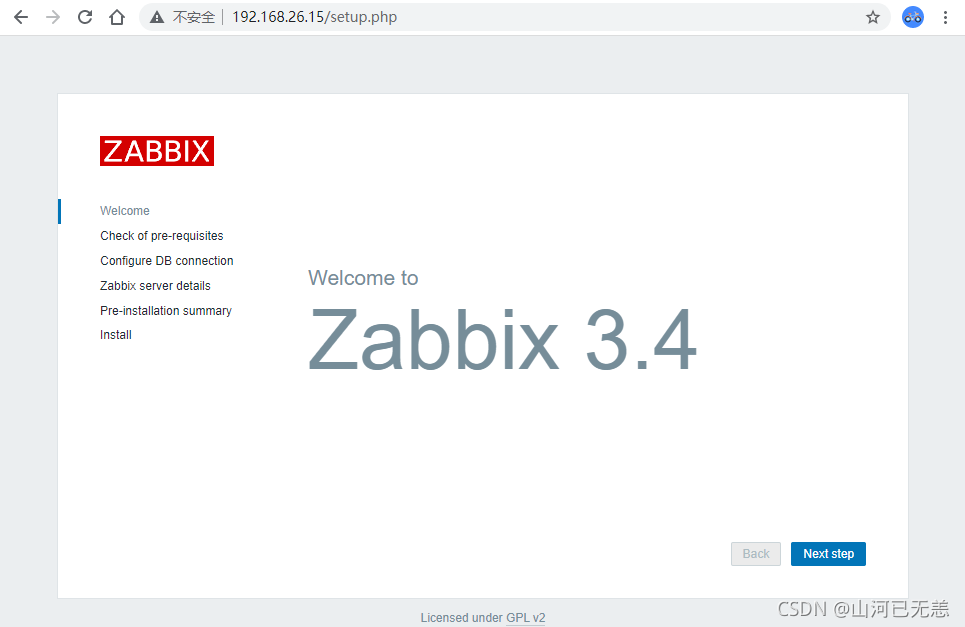
3.1.3 初始化
嗯。这里可能会遇到配置文件无法写入,无法覆盖的问题,主要是权限的问题,需要给/usr/share/nginx/html/授权
默认登录账户admin,默认密码zabbix
 |
 |
 |
 |
| 默认登录账户admin,默认密码zabbix |
 |
 |
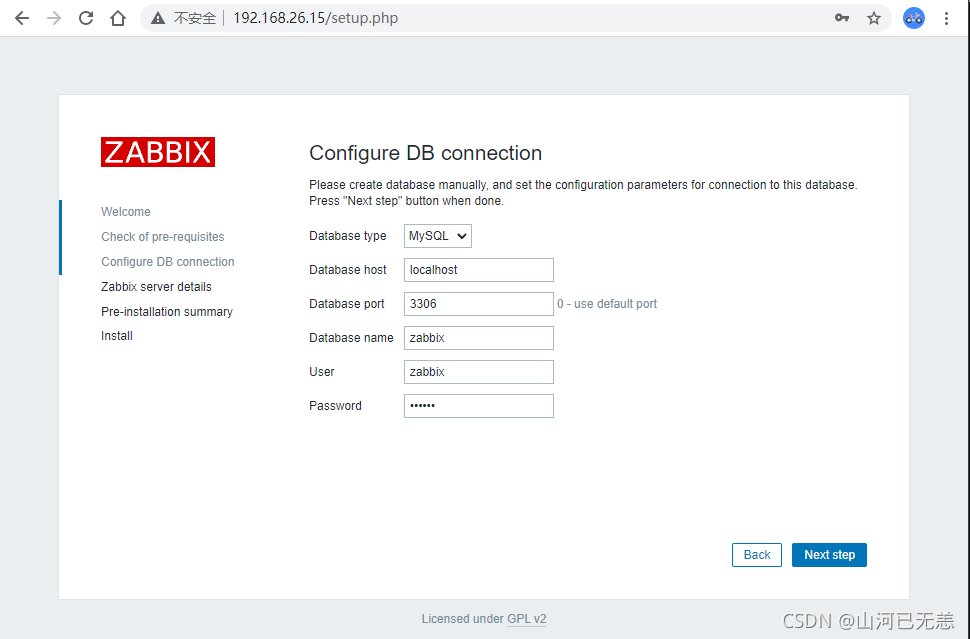
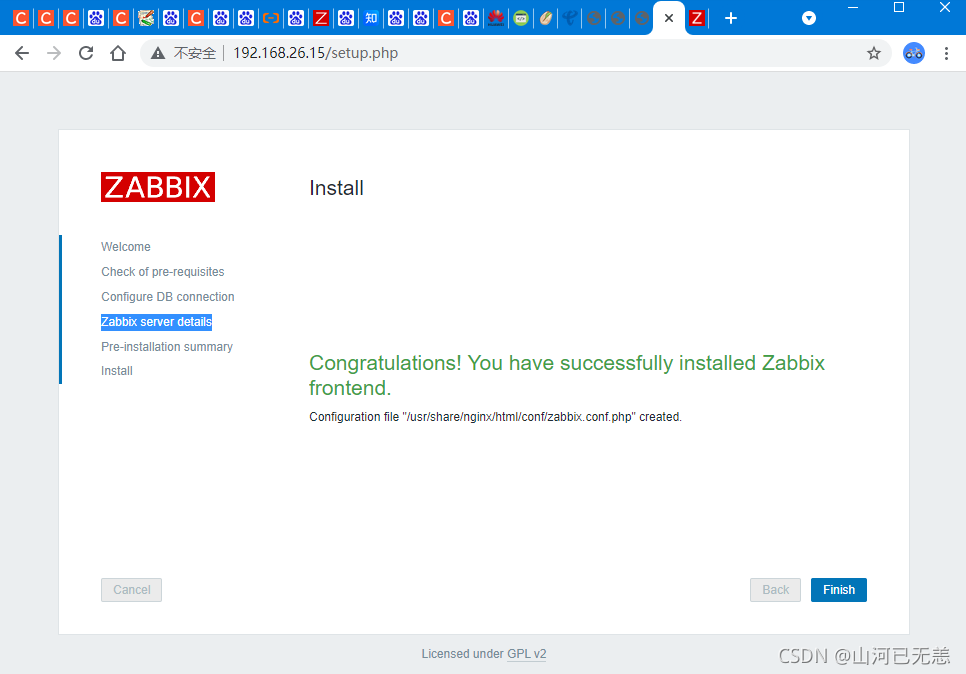
写入的配置文件
┌──[root@zabbixserver]-[/usr/share/nginx/html/conf]
└─$ ls
maintenance.inc.php  zabbix.conf.php  zabbix.conf.php.bak
┌──[root@zabbixserver]-[/usr/share/nginx/html/conf]
└─$ cat zabbix.conf.php
<?php
// Zabbix GUI configuration file.
global $DB;

$DB['TYPE']     = 'MYSQL';
$DB['SERVER']   = 'localhost';
$DB['PORT']     = '3306';
$DB['DATABASE'] = 'zabbix';
$DB['USER']     = 'zabbix';
$DB['PASSWORD'] = 'zabbix';

// Schema name. Used for IBM DB2 and PostgreSQL.
$DB['SCHEMA'] = '';

$ZBX_SERVER      = 'localhost';
$ZBX_SERVER_PORT = '10051';
$ZBX_SERVER_NAME = '';

$IMAGE_FORMAT_DEFAULT = IMAGE_FORMAT_PNG;
┌──[root@zabbixserver]-[/usr/share/nginx/html/conf]
└─$
| 设置中文环境(推荐英文,中文小部分为乱码) |
|---|
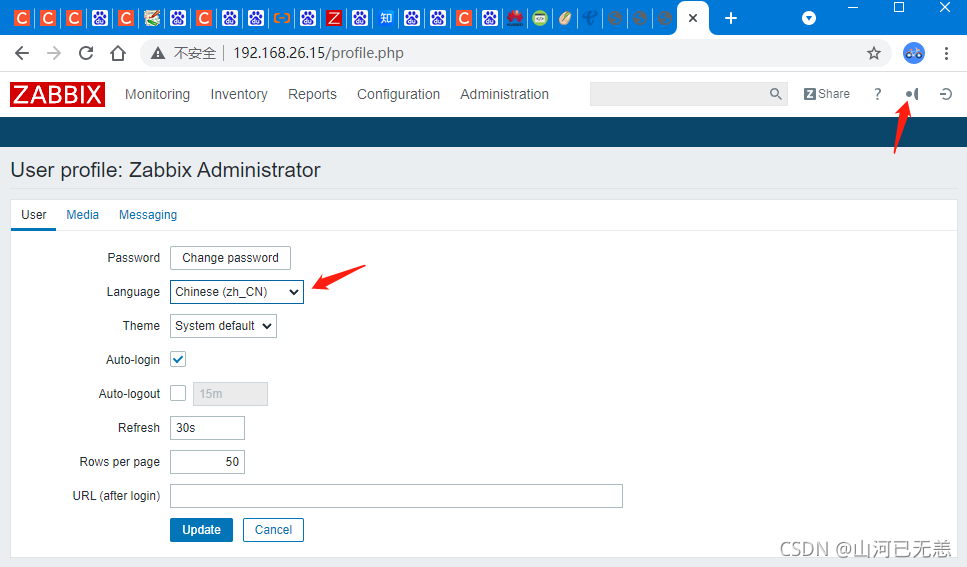 |
3.1.4 启动服务
修改配置文件
┌──[root@zabbixserver]-[/usr/share/nginx/html/conf]
└─$ vim /usr/local/etc/zabbix_server.conf
######修改配置, 指定zabbix管理的数据库信息
[root@zabbixserver ~]# vim /usr/local/etc/zabbix_server.conf
......
#数据库服务器的地址,本机localhost,如果在其他主机上,指定IP地址
85 DBHost=localhost
......
#mysql中的数据库名为zabbix,用于存放监控数据
95 DBName=zabbix
......
#登录mysql的用户名为zabbix
111 DBUser=zabbix
......
#登录mysql的密码为zabbix
119 DBPassword=zabbix
......
####启动服务
必须创建用户zabbix,用于启动zabbix服务
#######必须创建用户zabbix,用于启动zabbix服务

┌──[root@zabbixserver]-[/usr/share/nginx/html/conf]
└─$ useradd -s /sbin/nologin zabbix
┌──[root@zabbixserver]-[/usr/share/nginx/html/conf]
└─$ zabbix_server
┌──[root@zabbixserver]-[/usr/share/nginx/html/conf]
└─$
######查看端口,zabbix服务端口号:10051
┌──[root@zabbixserver]-[/usr/share/nginx/html/conf]
└─$ ss -ntulpa | grep zabbix
tcp    LISTEN     0      128       *:10051                 *:*                   users:(("zabbix_server",pid=25481,fd=4),("zabbix_server",pid=25480,fd=4),("zabbix_server",pid=25478,fd=4),("zabbix_server",pid=25477,fd=4),("zabbix_server",pid=25475,fd=4),("zabbix_server",pid=25474,fd=4),("zabbix_server",pid=25473,fd=4),("zabbix_server",pid=25471,fd=4),("zabbix_server",pid=25470,fd=4),("zabbix_server",pid=25468,fd=4),("zabbix_server",pid=25467,fd=4),("zabbix_server",pid=25466,fd=4),("zabbix_server",pid=25464,fd=4),("zabbix_server",pid=25463,fd=4),("zabbix_server",pid=25462,fd=4),("zabbix_server",pid=25460,fd=4),("zabbix_server",pid=25459,fd=4),("zabbix_server",pid=25458,fd=4),("zabbix_server",pid=25456,fd=4),("zabbix_server",pid=25455,fd=4),("zabbix_server",pid=25454,fd=4),("zabbix_server",pid=25453,fd=4),("zabbix_server",pid=25451,fd=4),("zabbix_server",pid=25450,fd=4),("zabbix_server",pid=25448,fd=4),("zabbix_server",pid=25447,fd=4),("zabbix_server",pid=25445,fd=4),("zabbix_server",pid=25444,fd=4),("zabbix_server",pid=25443,fd=4),("zabbix_server",pid=25442,fd=4),("zabbix_server",pid=25441,fd=4),("zabbix_server",pid=25440,fd=4),("zabbix_server",pid=25439,fd=4),("zabbix_server",pid=25434,fd=4))
┌──[root@zabbixserver]-[/usr/share/nginx/html/conf]
└─$
 |
3.1.5 开机自启
| 将 zabbix_server 设置为开机自启服务 |
|---|
| /etc/rc.local 为开机会执行的脚本文件 |
| 可以将任意命令写入该脚本文件,开机时就会被执行 |
| 该文件默认没有可执行权限 |
└─$ echo zabbix_server >> /etc/rc.d/rc.local
┌──[root@zabbixserver]-[/usr/share/nginx/html/conf]
└─$ echo zabbix_agentd >> /etc/rc.d/rc.local
┌──[root@zabbixserver]-[/usr/share/nginx/html/conf]
└─$ chmod +x /etc/rc.d/rc.local
┌──[root@zabbixserver]-[/usr/share/nginx/html/conf]
└─$bash
3.2 部署Zabbix被监控端服务器
  scp -r /root/zabbix-3.4.4 root@192.168.26.13:/root/
  scp -r /root/zabbix-3.4.4 root@192.168.26.14:/root/
3.2.1 配置被监控主机
┌──[root@zabbixserver]-[/ansible]
└─$ ansible web -m shell -a "yum -y install  gcc pcre-devel autoconf"
┌──[root@zabbixserver]-[/ansible]
└─$ ansible web -m shell -a "cd /root/zabbix-3.4.4;./configure --enable-agent;make install;ls /usr/local/etc/"
.......
***********************************************************
*            Now run 'make install'                       *
*                                                         *
*            Thank you for using Zabbix!                  *
*              <http://www.zabbix.com>                    *
***********************************************************

CDPATH="${ZSH_VERSION+.}:" && cd . && /bin/sh /root/zabbix-3.4.4/missing aclocal-1.15 -I m4/root/zabbix-3.4.4/missing: line 81: aclocal-1.15: command not found
WARNING: 'aclocal-1.15' is missing on your system.
         You should only need it if you modified 'acinclude.m4' or
         'configure.ac' or m4 files included by 'configure.ac'.
         The 'aclocal' program is part of the GNU Automake package:
         <http://www.gnu.org/software/automake>
         It also requires GNU Autoconf, GNU m4 and Perl in order to run:
         <http://www.gnu.org/software/autoconf>
         <http://www.gnu.org/software/m4/>
         <http://www.perl.org/>
make: *** [aclocal.m4] Error 127
报错了,提示少一个包aclocal-1.15 ,我们装一下。
┌──[root@zabbixserver]-[/ansible]
└─$ ls
ansible.cfg  inventory
┌──[root@zabbixserver]-[/ansible]
└─$ ansible web -m shell -a "cd /root/zabbix-3.4.4;./configure --enable-agent;yum -y install automake;autoreconf -ivf;make install;ls /usr/local/etc/"
查看配置文件路径,只有客户端配置文件
#######查看配置文件路径,只有客户端配置文件
┌──[root@zabbixserver]-[/ansible]
└─$ ansible web -m shell -a "ls /usr/local/etc/"
192.168.26.14 | CHANGED | rc=0 >>
zabbix_agentd.conf
zabbix_agentd.conf.d
192.168.26.13 | CHANGED | rc=0 >>
zabbix_agentd.conf
zabbix_agentd.conf.d
获取目标主机监控数据和向目标主机发送监控数据的命令
#########获取目标主机监控数据和向目标主机发送监控数据的命令
#zabbix_get 获取监控数据的命令
#zabbix_sender 发送监控数据的命令
┌──[root@zabbixserver]-[/ansible]
└─$ ansible web -m shell -a "ls /usr/local/bin/"
192.168.26.13 | CHANGED | rc=0 >>
zabbix_get
zabbix_sender
192.168.26.14 | CHANGED | rc=0 >>
zabbix_get
zabbix_sender
查看启动zabbix客户端的命令
########查看启动zabbix客户端的命令
┌──[root@zabbixserver]-[/ansible]
└─$ ansible web -m shell -a "ls /usr/local/sbin/"
192.168.26.13 | CHANGED | rc=0 >>
zabbix_agentd
192.168.26.14 | CHANGED | rc=0 >>
zabbix_agentd
┌──[root@zabbixserver]-[/ansible]
└─$
修改配置文件
允许被哪些服务器监控,允许自己监控自己,允许26.15来监控自己
┌──[root@zabbixserver]-[/ansible]
└─$ ansible web -m  lineinfile  -a "path=/usr/local/etc/zabbix_agentd.conf regexp=^Server=127.0.0.1$ line=Server=127.0.0.1,192.168.26.15"
192.168.26.14 | CHANGED => {
    "ansible_facts": {
        "discovered_interpreter_python": "/usr/bin/python"
    },
    "backup": "",
    "changed": true,
    "msg": "line replaced"
}
192.168.26.13 | CHANGED => {
    "ansible_facts": {
        "discovered_interpreter_python": "/usr/bin/python"
    },
    "backup": "",
    "changed": true,
    "msg": "line replaced"
}
┌──[root@zabbixserver]-[/ansible]
└─$ ansible web -m shell -a 'cat  /usr/local/etc/zabbix_agentd.conf | grep Server=127.0.0.1'
192.168.26.13 | CHANGED | rc=0 >>
#       Example: Server=127.0.0.1,192.168.1.0/24,::1,2001:db8::/32,zabbix.domain
Server=127.0.0.1,192.168.26.15
192.168.26.14 | CHANGED | rc=0 >>
#       Example: Server=127.0.0.1,192.168.1.0/24,::1,2001:db8::/32,zabbix.domain
Server=127.0.0.1,192.168.26.15
┌──[root@zabbixserver]-[/ansible]
└─$
监控服务器的IP地址和端口号
######监控服务器的IP地址和端口号
┌──[root@zabbixserver]-[/ansible]
└─$ ansible web -m  lineinfile  -a "path=/usr/local/etc/zabbix_agentd.conf regexp=^ServerActive=127.0.0.1$ line=ServerActive=192.168.26.15:10051"
192.168.26.14 | CHANGED => {
    "ansible_facts": {
        "discovered_interpreter_python": "/usr/bin/python"
    },
    "backup": "",
    "changed": true,
    "msg": "line replaced"
}
192.168.26.13 | CHANGED => {
    "ansible_facts": {
        "discovered_interpreter_python": "/usr/bin/python"
    },
    "backup": "",
    "changed": true,
    "msg": "line replaced"
}
┌──[root@zabbixserver]-[/ansible]
└─$ ansible web -m shell -a 'cat  /usr/local/etc/zabbix_agentd.conf | grep ServerActive=127.0.0.1'
192.168.26.14 | CHANGED | rc=0 >>
#       Example: ServerActive=127.0.0.1:20051,zabbix.domain,[::1]:30051,::1,[12fc::1]
192.168.26.13 | CHANGED | rc=0 >>
#       Example: ServerActive=127.0.0.1:20051,zabbix.domain,[::1]:30051,::1,[12fc::1]
┌──[root@zabbixserver]-[/ansible]
└─$ ansible web -m shell -a 'cat  /usr/local/etc/zabbix_agentd.conf | grep ServerActive='
192.168.26.14 | CHANGED | rc=0 >>
#       Example: ServerActive=127.0.0.1:20051,zabbix.domain,[::1]:30051,::1,[12fc::1]
# ServerActive=
ServerActive=192.168.26.15:10051
192.168.26.13 | CHANGED | rc=0 >>
#       Example: ServerActive=127.0.0.1:20051,zabbix.domain,[::1]:30051,::1,[12fc::1]
# ServerActive=
ServerActive=192.168.26.15:10051
启动服务
└─$ ansible web -m shell -a 'useradd -s /sbin/nologin zabbix;zabbix_agentd;ss -ntulpa | grep zabbix'
192.168.26.14 | CHANGED | rc=0 >>
tcp    LISTEN     0      128       *:10050                 *:*                   users:(("zabbix_agentd",pid=59879,fd=4),("zabbix_agentd",pid=59878,fd=4),("zabbix_agentd",pid=59877,fd=4),("zabbix_agentd",pid=59876,fd=4),("zabbix_agentd",pid=59875,fd=4),("zabbix_agentd",pid=59873,fd=4))
192.168.26.13 | CHANGED | rc=0 >>
tcp    LISTEN     0      128       *:10050                 *:*                   users:(("zabbix_agentd",pid=47251,fd=4),("zabbix_agentd",pid=47250,fd=4),("zabbix_agentd",pid=47249,fd=4),("zabbix_agentd",pid=47248,fd=4),("zabbix_agentd",pid=47247,fd=4),("zabbix_agentd",pid=47246,fd=4))
┌──[root@zabbixserver]-[/ansible]
└─$
3.2.3 开机自启
| 将zabbix_agend设置为开机自启服务 |
|---|
/etc/rc.local 为开机会执行的脚本文件 |
| 可以将任意命令写入该脚本文件,开机时就会被执行 |
| 该文件默认没有可执行权限 |
┌──[root@zabbixserver]-[/ansible]
└─$ ansible web -m shell -a 'echo zabbix_agentd >> /etc/rc.d/rc.local;chmod +x /etc/rc.d/rc.local'
192.168.26.14 | CHANGED | rc=0 >>

192.168.26.13 | CHANGED | rc=0 >>

┌──[root@zabbixserver]-[/ansible]
└─$
四、zabbix 实战
一、基础监控
1.2 添加监控主机
| 添加监控主机 |
|---|
| Host (主机) 是监控的基本载体,Zabbix 所有监控都是基于Host,通过Configuration —> Hosts —> Create Host创建 |
| 注意设置中文环境后,中英文差异, 选择 “ 配置 ”,然后选择 “主机”,查看被监控的主机 |
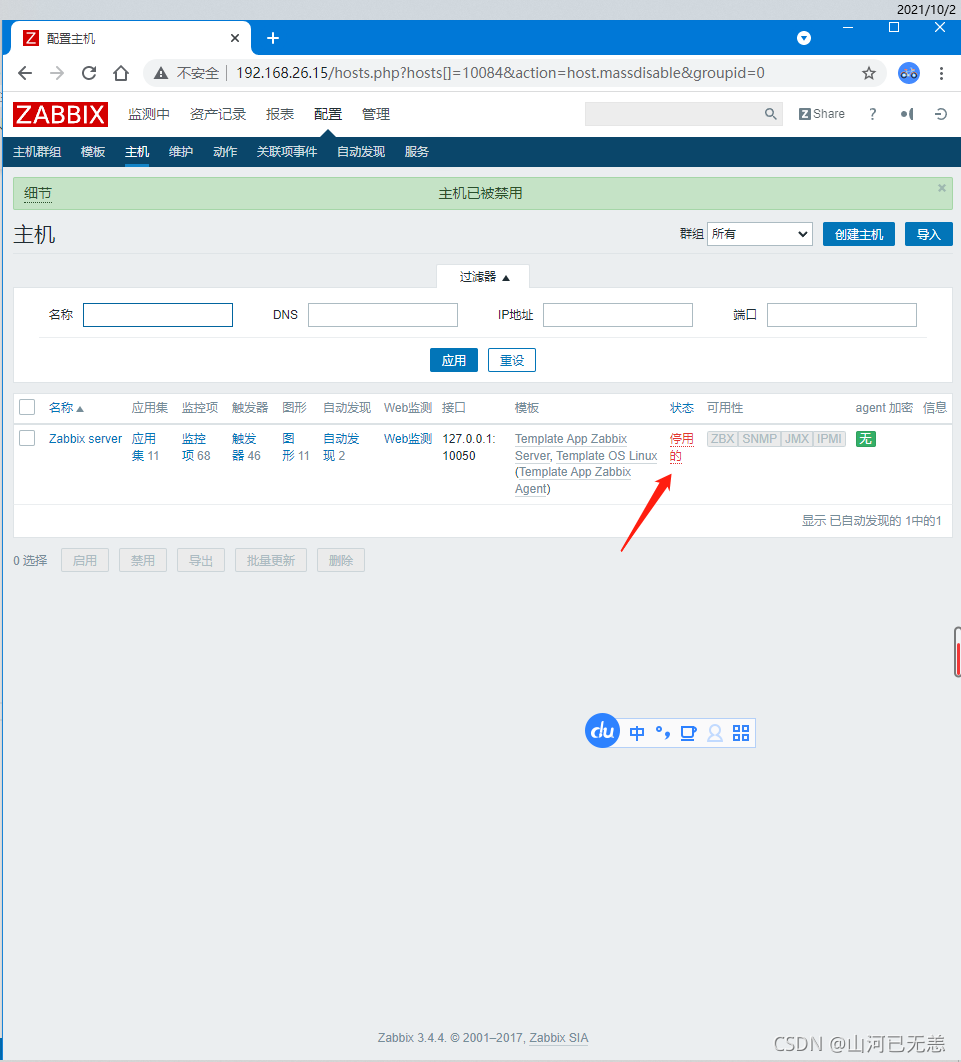 |
| 点击 “停用的”,然后选中 “确认”,开启监控状态 |
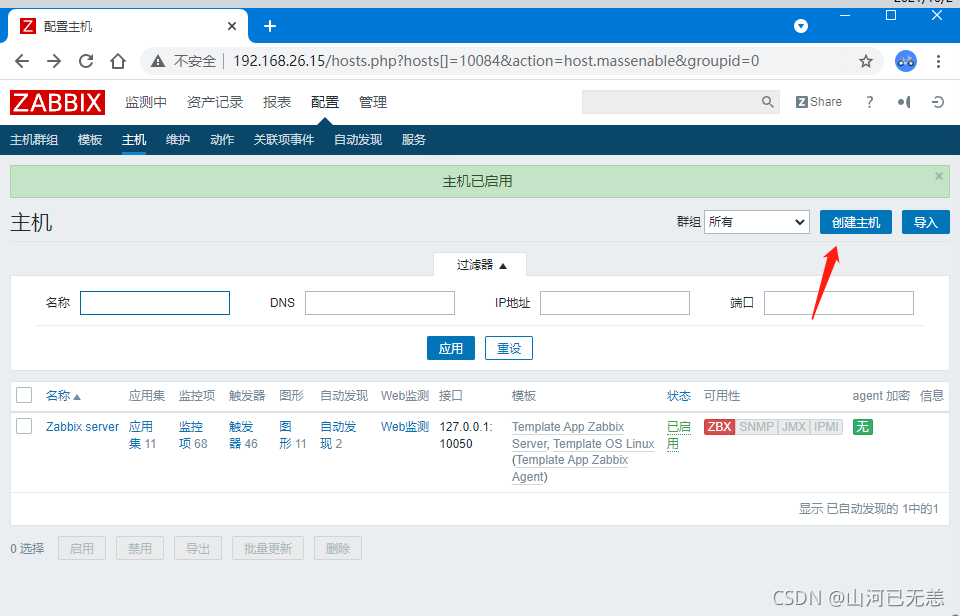 |
| 第一步:选择 “配置”, 然后选择 “主机”, 最后选择 “创建主机” |
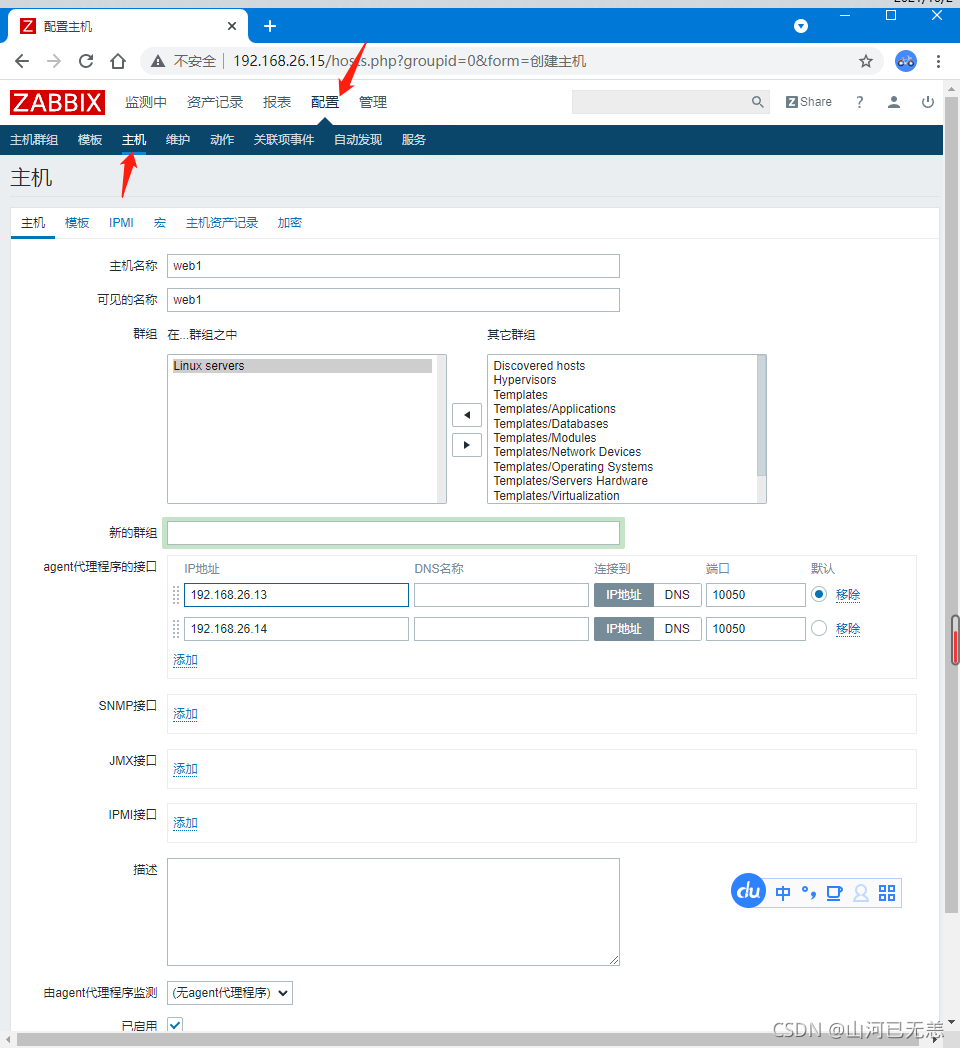 |
| 第二步:设置被监控端的主机名, 将主机添加到任意一个组中 |
| 第三步:设置被监控端的IP地址和端口号 |
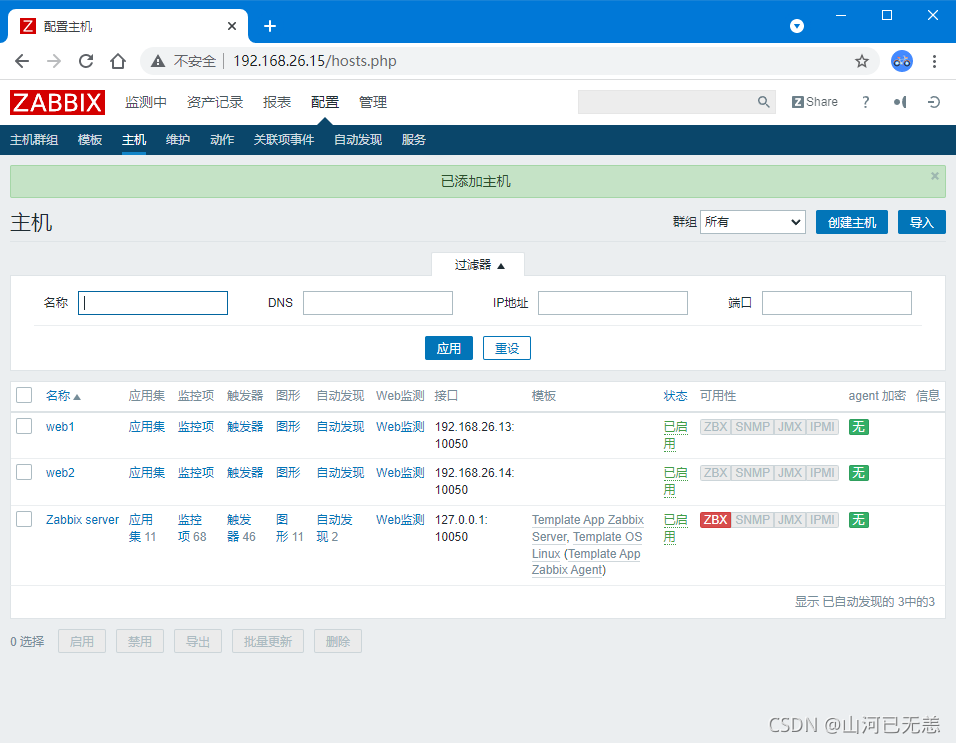
| 第四步:点击最后的 “添加按钮”, 添加web1主机完成 |
 |
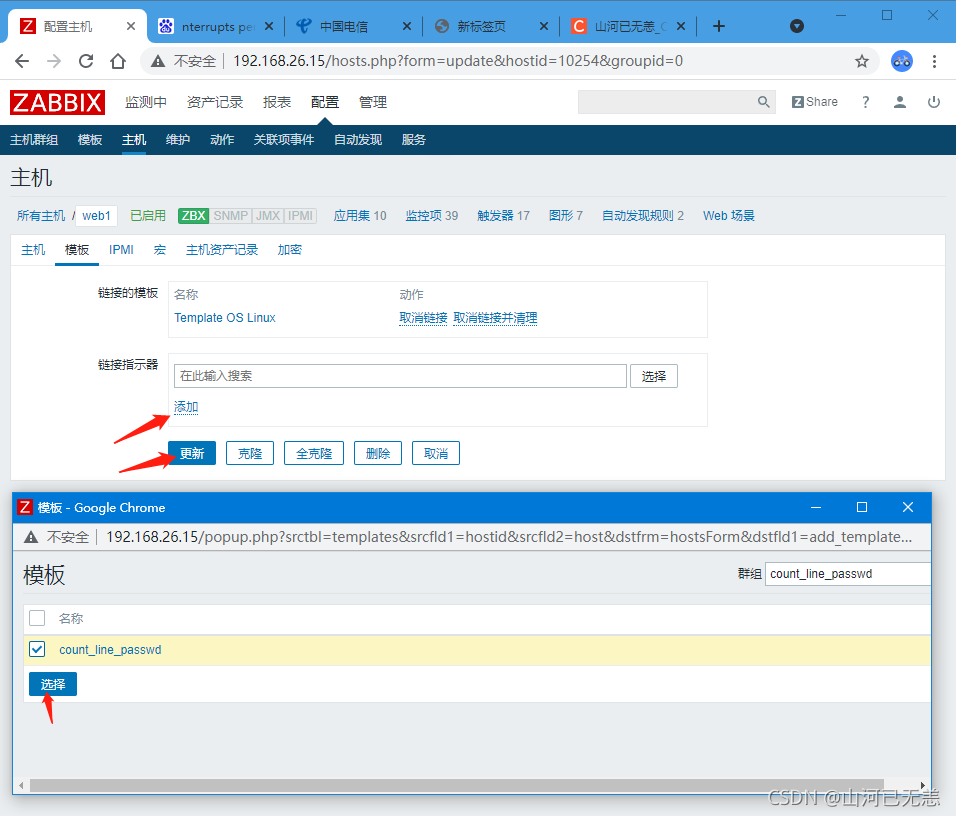
| 应用监控模板 |
|---|
 |
| 为主机添加关联的监控模板 |
| 在 “Templates” 模板选项卡页面中 |
| 找到 Link new templates,select 选项合适的模板添加 |
| 这里我们选择 Template OS Linux模板 |
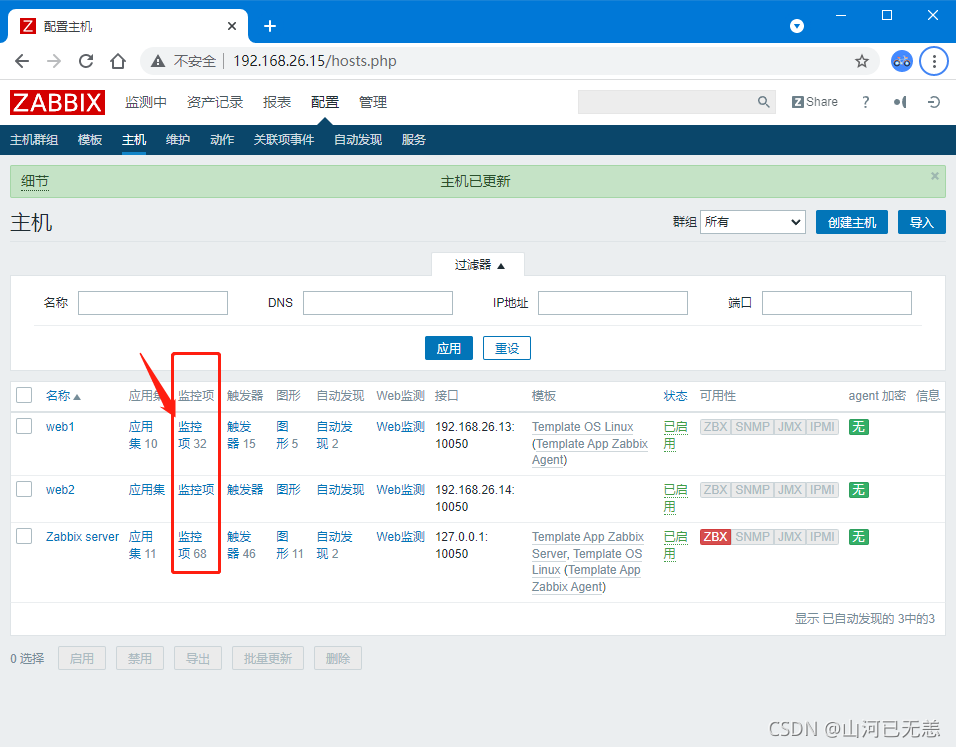 |
| 这些32个zabbix默认的监控项,会对Linux系统的内存,CPU,网卡流量,磁盘等进行监控; |
| 选择对应的模板,则该模板中默认的所有监控选项都可以使用 |
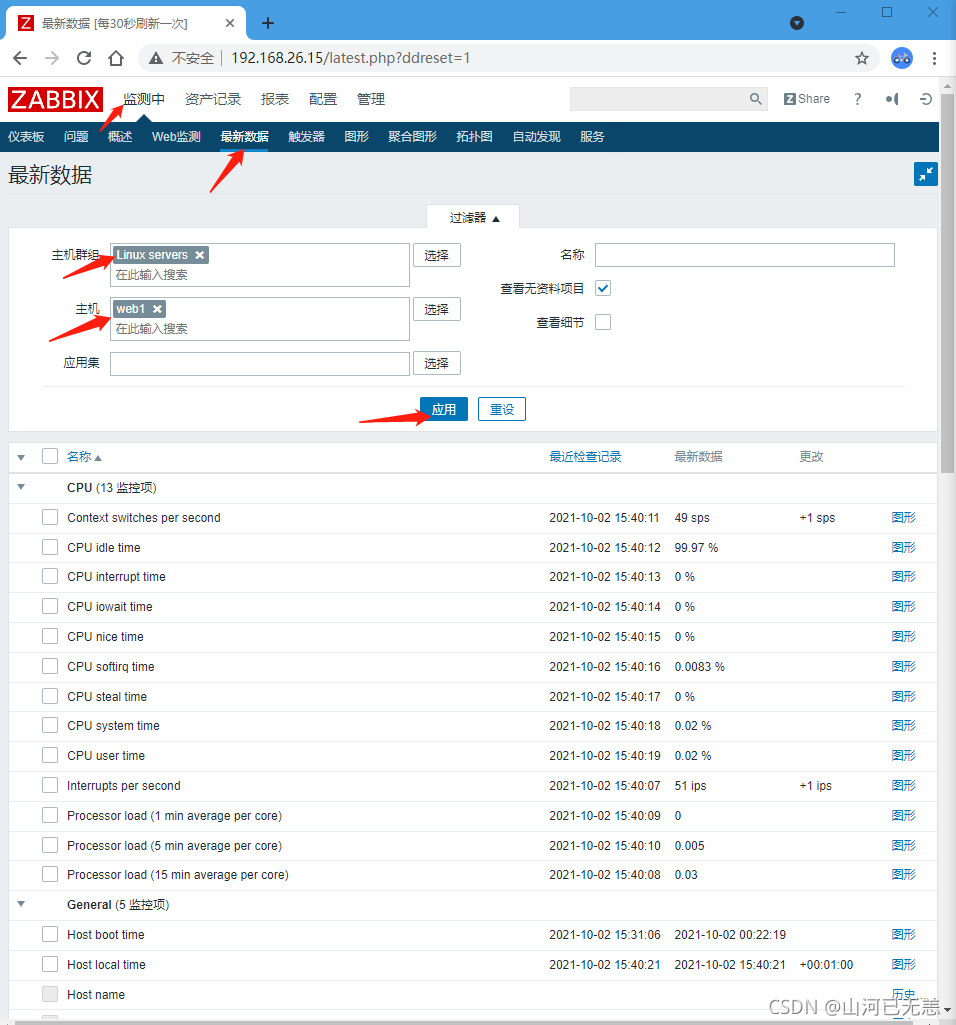
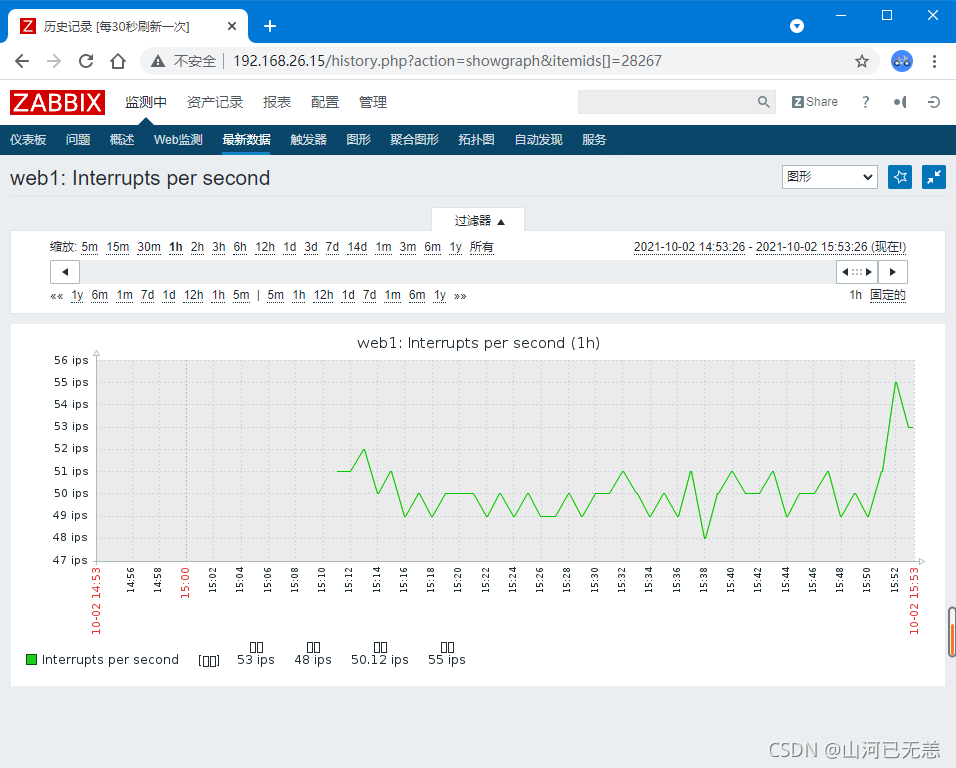
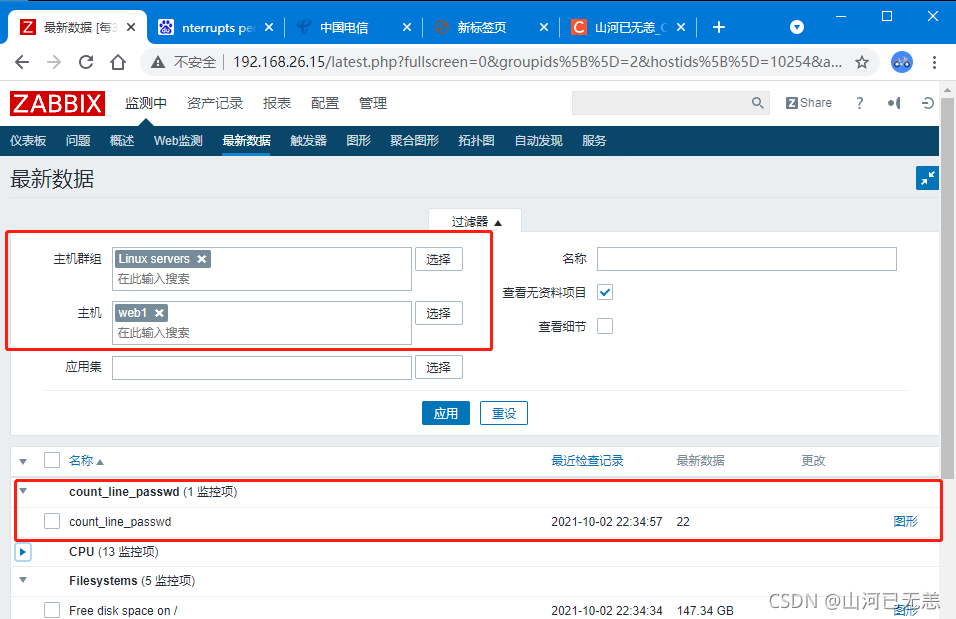
| 查看监控数据 |
|---|
| 可以点击“Monitoring” —> “Latest data” |
| 在过滤器中填写条件,根据群组和主机搜索即可 |
| 第一步:选择 “监测中”,选择“最新数据”,选择“主机群组”,选择 “主机”,最后选择 “应用” |
 |
 |
五、自定义监控
5.1 自定义key
被监控端修改Agent配置文件
#####查看被监控主机web1的配置文件
┌──[root@zabbixserver]-[/ansible]
└─$ ansible web -m shell -a 'ls /usr/local/etc'
192.168.26.14 | CHANGED | rc=0 >>
zabbix_agentd.conf
zabbix_agentd.conf.d
192.168.26.13 | CHANGED | rc=0 >>
zabbix_agentd.conf
zabbix_agentd.conf.d
┌──[root@zabbixserver]-[/ansible]
└─$ ansible web -m shell -a 'cat /usr/local/etc/zabbix_agentd.conf'
192.168.26.14 | CHANGED | rc=0 >>
#####被监控端修改Agent配置文件
[root@web1 ~]# vim /usr/local/etc/zabbix_agentd.conf
......
#########加载配置文件的目录,取消注释,也是自定义选项存放的目录
263 # Include=/usr/local/etc/zabbix_agentd.userparams.conf
264 Include=/usr/local/etc/zabbix_agentd.conf.d/
265 # Include=/usr/local/etc/zabbix_agentd.conf.d/*.conf
......
加载配置文件的目录,取消注释,也是自定义选项存放的目录
┌──[root@zabbixserver]-[/ansible]
└─$ ansible web -m shell -a "sed -i '264i  Include=/usr/local/etc/zabbix_agentd.conf.d/' /usr/local/etc/zabbix_agentd.conf"
开启自定义监控功能,默认注释
##########开启自定义监控功能,默认注释
280 UnsafeUserParameters=1
281
282 ### Option: UserParameter
283 # User-defined parameter to monitor. There can be s everal userdefined parameters.
284 # Format: UserParameter=<key>,<shell command>
285 # See 'zabbix_agentd' directory for examples.
286 #
287 # Mandatory: no
288 # Default:
289 # UserParameter=
┌──[root@zabbixserver]-[/ansible]
└─$ ansible web -m shell -a "sed -i '282i   UnsafeUserParameters=1' /usr/local/etc/zabbix_agentd.conf"
[WARNING]: Consider using the replace, lineinfile or template module rather than running 'sed'.  If
you need to use command because replace, lineinfile or template is insufficient you can add 'warn:
false' to this command task or set 'command_warnings=False' in ansible.cfg to get rid of this message.
192.168.26.14 | CHANGED | rc=0 >>

192.168.26.13 | CHANGED | rc=0 >>

┌──[root@zabbixserver]-[/ansible]
└─$
创建自定义key
######进入到自定义监控文件的目录下
[root@web1 ~]# cd /usr/local/etc/zabbix_agentd.conf.d/
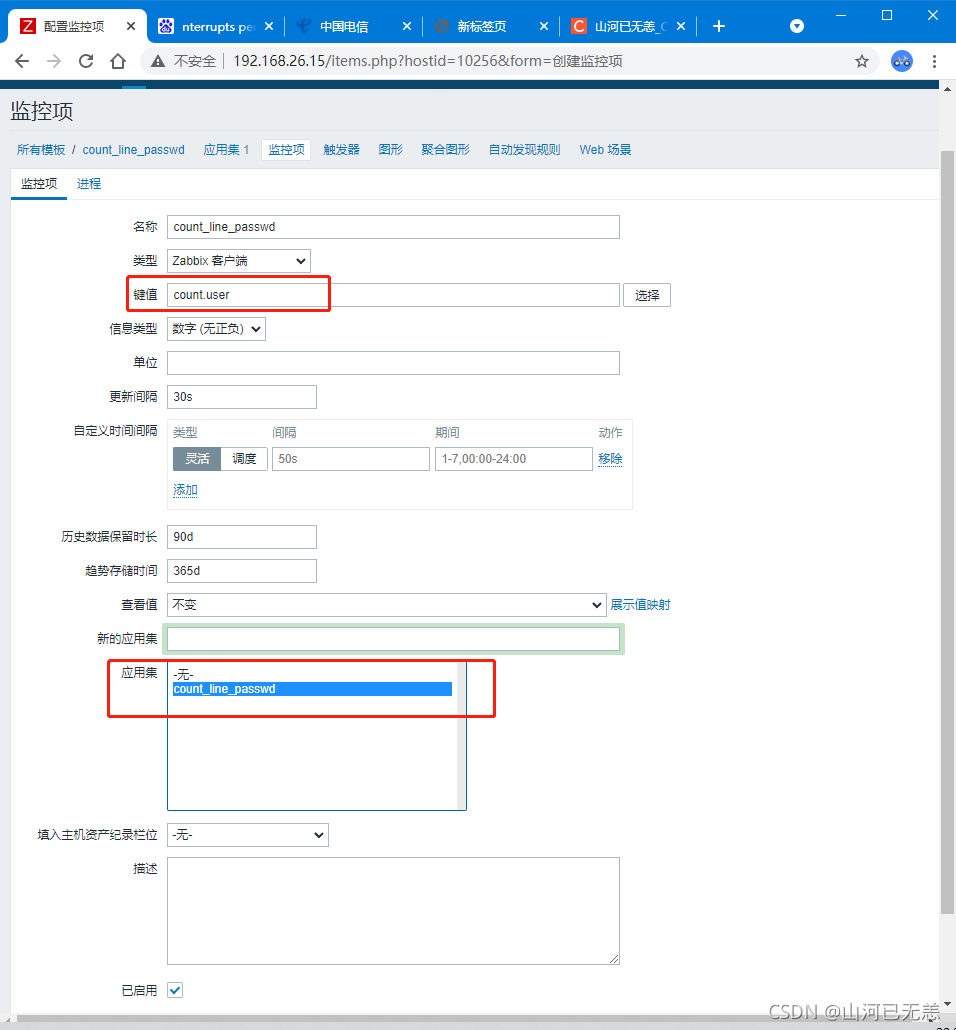
####创建自定义监控项,文件名为count.line.passwd【任意取名】
##自定义监控项格式: UserParameter=<key>,<shell command>
#key为监控项名称,后面跟具体命令
[root@web1 zabbix_agentd.conf.d]# vim count.line.passwd
UserParameter=count.user,sed -n '$=' /etc/passwd
┌──[root@zabbixserver]-[/ansible]
└─$ ansible web -m shell -a 'cd /usr/local/etc/zabbix_agentd.conf.d/;echo "UserParameter=count.user,sed -n '$=' /etc/passwd" >count.line.passwd '
192.168.26.13 | CHANGED | rc=0 >>

192.168.26.14 | CHANGED | rc=0 >>

┌──[root@zabbixserver]-[/ansible]
└─$ ansible web -m shell -a "cat  /usr/local/etc/zabbix_agentd.conf.d/count.line.passwd"
192.168.26.14 | CHANGED | rc=0 >>
UserParameter=count.user,sed -n $= /etc/passwd
192.168.26.13 | CHANGED | rc=0 >>
UserParameter=count.user,sed -n $= /etc/passwd
┌──[root@zabbixserver]-[/ansible]
└─$
重启Agentd
#####被监控端配置文件发生变化,需要重启服务
##查看命令是由哪个软件提供的,没安装,则需要安装
[root@web1 ~]# yum provides "killall"
......
psmisc-22.20-15.el7.x86_64 : Utilities for managing processes
##杀死进程,重新开启agent服务
[root@web1 ~]# killall zabbix_agentd
[root@web1 ~]# zabbix_agentd
##查看端口信息
┌──[root@zabbixserver]-[/ansible]
└─$ ansible web -m shell -a "yum -y install psmisc;killall zabbix_agentd;zabbix_agentd;ss -ntulpa | grep zabbix"
[WARNING]: Consider using the yum module rather than running 'yum'.  If you need to use command
because yum is insufficient you can add 'warn: false' to this command task or set
'command_warnings=False' in ansible.cfg to get rid of this message.
192.168.26.13 | CHANGED | rc=0 >>
Loaded plugins: fastestmirror
Loading mirror speeds from cached hostfile
Package psmisc-22.20-17.el7.x86_64 already installed and latest version
Nothing to do
tcp    LISTEN     0      128       *:10050                 *:*                   users:(("zabbix_agentd",pid=51045,fd=4))zabbix_agentd: no process found
192.168.26.14 | CHANGED | rc=0 >>
Loaded plugins: fastestmirror
Loading mirror speeds from cached hostfile
Package psmisc-22.20-17.el7.x86_64 already installed and latest version
Nothing to do
tcp    LISTEN     0      128       *:10050                 *:*                   users:(("zabbix_agentd",pid=61926,fd=4),("zabbix_agentd",pid=61925,fd=4),("zabbix_agentd",pid=61924,fd=4),("zabbix_agentd",pid=61923,fd=4),("zabbix_agentd",pid=61922,fd=4),("zabbix_agentd",pid=61921,fd=4))zabbix_agentd: no process found
┌──[root@zabbixserver]-[/ansible]
└─$
测试自定义key是否生效
#######注意:最后count.user为监控项的key,不是监控项的文件名
##作用:安全,入侵者创建用户后,从zabbix监控中可以实时看到
┌──[root@zabbixserver]-[/ansible]
└─$ ansible web -m shell -a "zabbix_get -s 127.0.0.1 -k count.user"
192.168.26.13 | CHANGED | rc=0 >>
21
192.168.26.14 | CHANGED | rc=0 >>
21
┌──[root@zabbixserver]-[/ansible]
└─$ ansible web -m user -a "name=test20211002 state=present"
192.168.26.13 | CHANGED => {
    "ansible_facts": {
        "discovered_interpreter_python": "/usr/bin/python"
    },
    "changed": true,
    "comment": "",
    "create_home": true,
    "group": 1002,
    "home": "/home/test20211002",
    "name": "test20211002",
    "shell": "/bin/bash",
    "state": "present",
    "system": false,
    "uid": 1002
}
192.168.26.14 | CHANGED => {
    "ansible_facts": {
        "discovered_interpreter_python": "/usr/bin/python"
    },
    "changed": true,
    "comment": "",
    "create_home": true,
    "group": 1002,
    "home": "/home/test20211002",
    "name": "test20211002",
    "shell": "/bin/bash",
    "state": "present",
    "system": false,
    "uid": 1002
}
┌──[root@zabbixserver]-[/ansible]
└─$ ansible web -m shell -a "zabbix_get -s 127.0.0.1 -k count.user"
192.168.26.13 | CHANGED | rc=0 >>
22
192.168.26.14 | CHANGED | rc=0 >>
22
┌──[root@zabbixserver]-[/ansible]
└─$
5.2 一些概念
| 创建自定义监控项的步骤: |
|---|
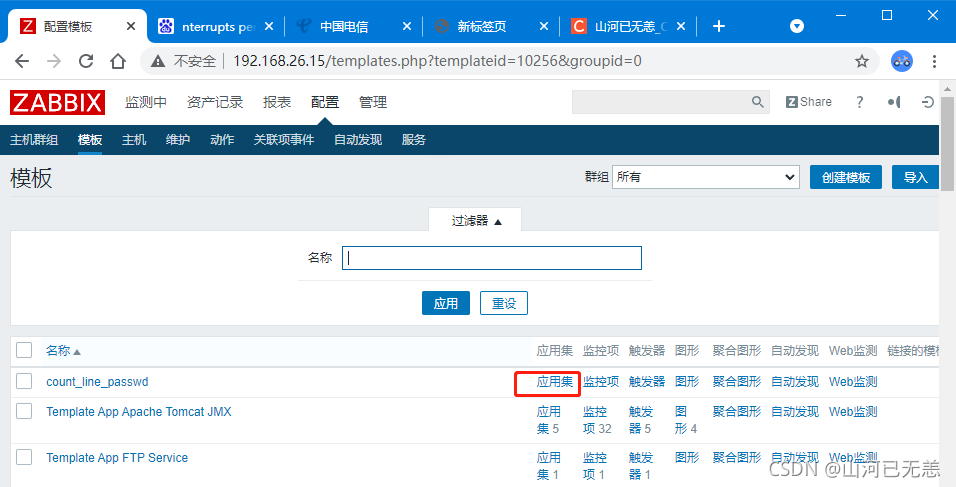
创建新的监控模板(默认监控项为空); |
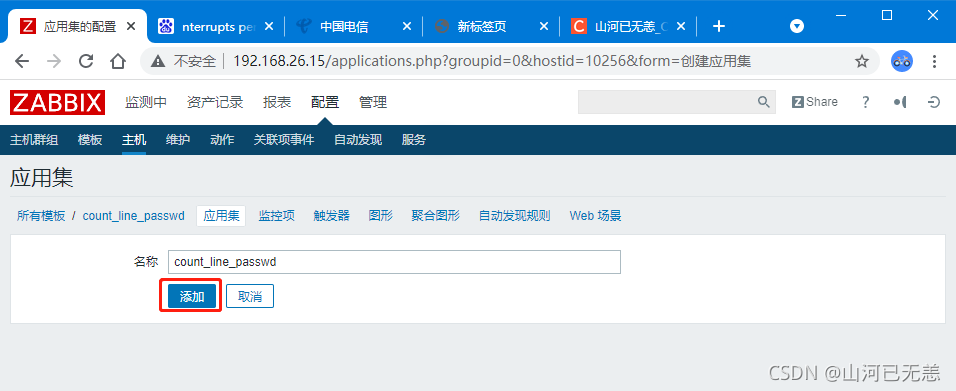
在监控模板中创建应用集(对监控项进行分类管理); |
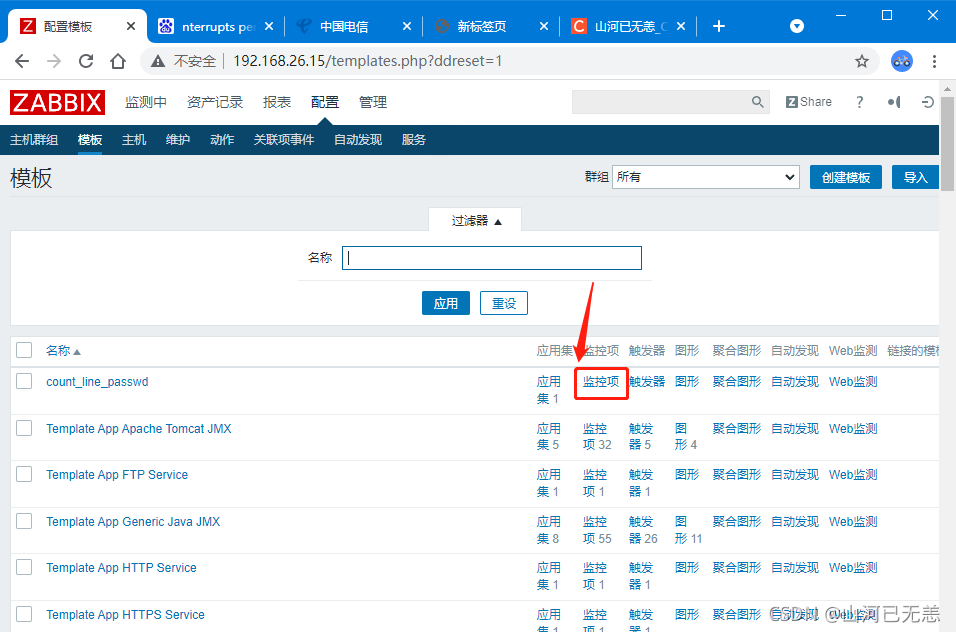
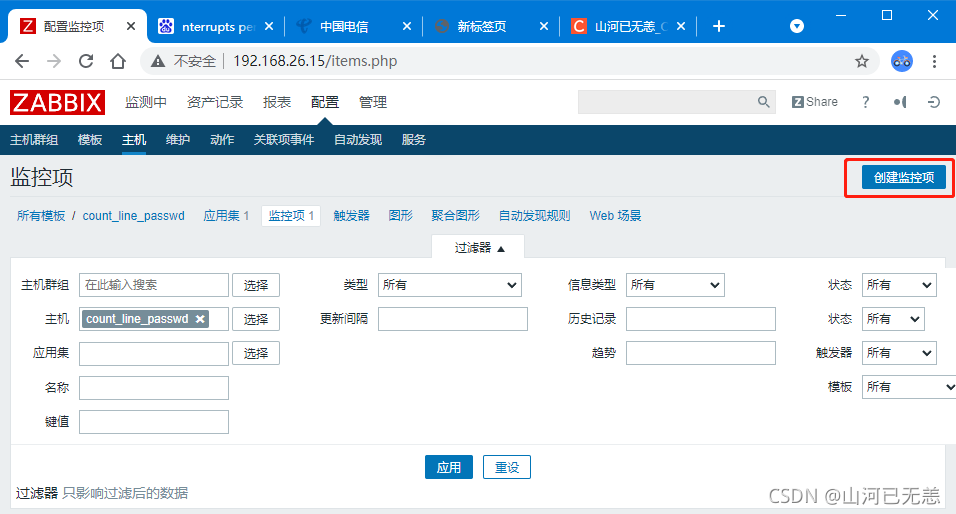
将自定义监控项加入到对应的应用集中; |
| 监控模板 —> 应用集 —> 监控项 |
 |
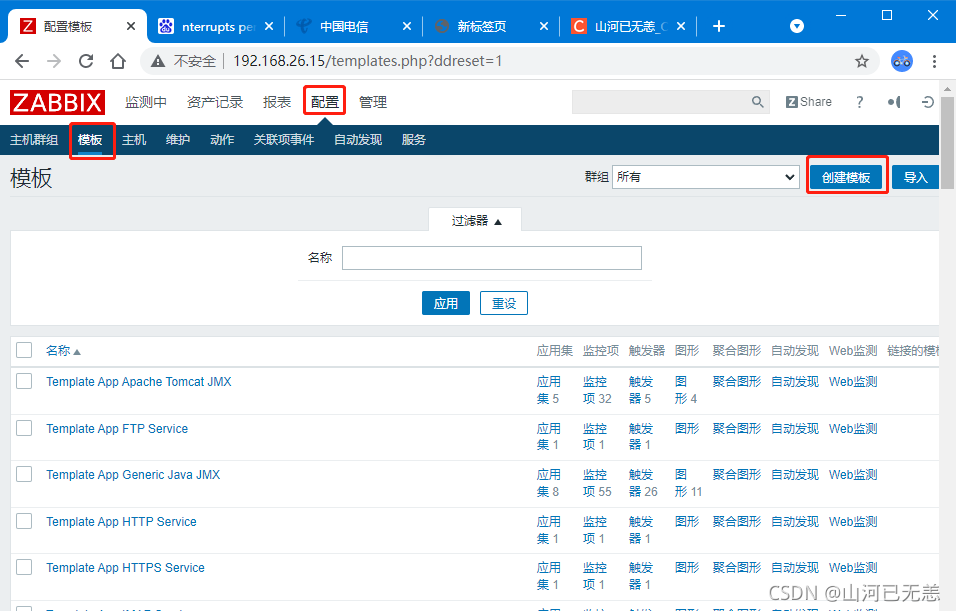
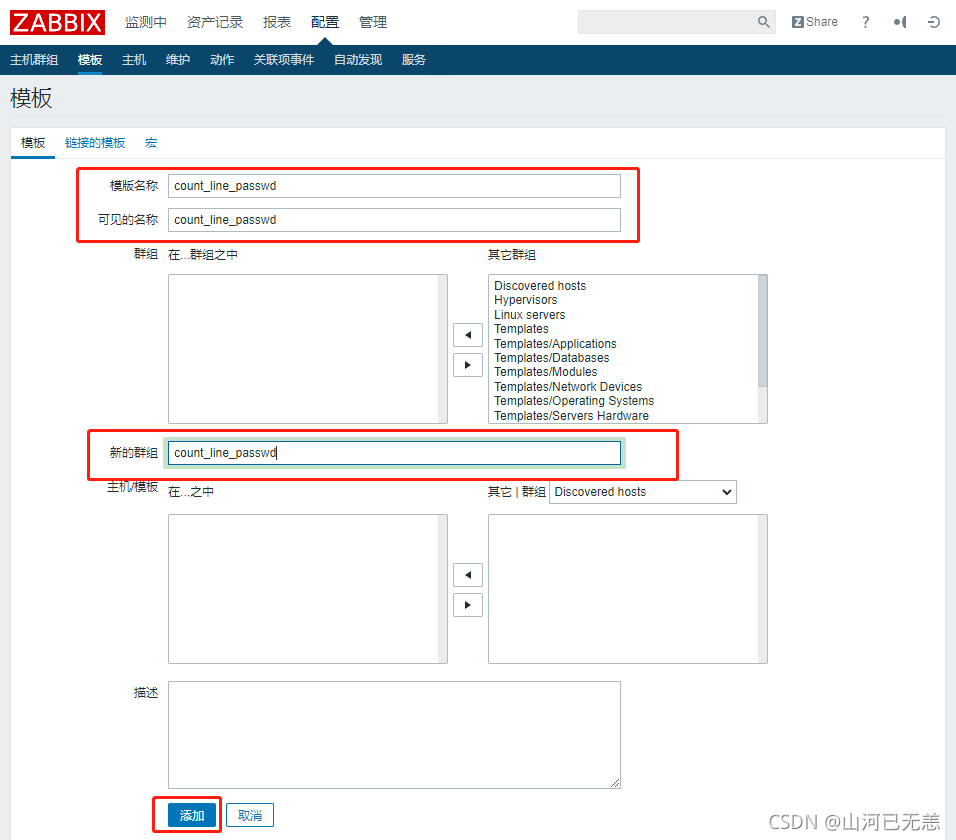
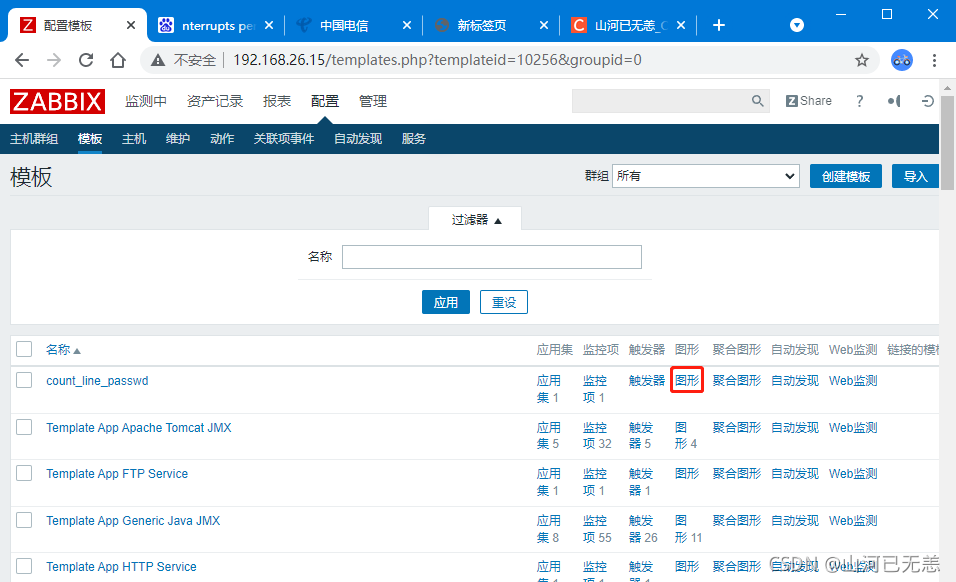
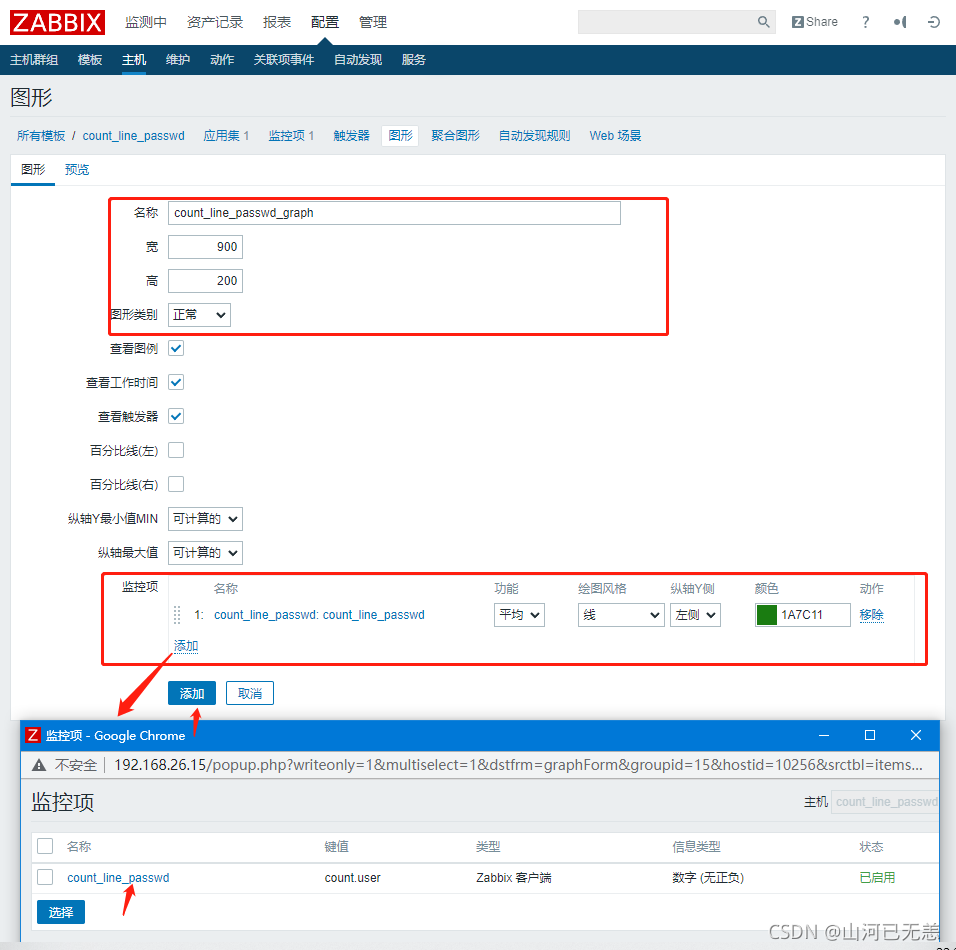
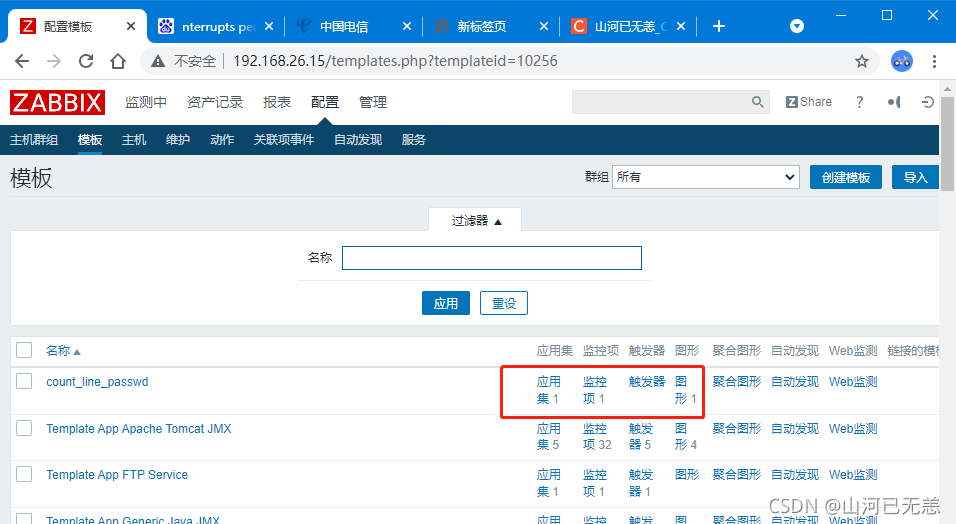
5.3 创建监控模板
| 登录监控服务器Web管理页面 |
|---|
| 选择 Configuration —> Templates 创建模板 |
 |
 |
 |
 |
 |
 |
 |
 |
 |
 |
 |
 |
 |
 |
 |
┌──[root@zabbixserver]-[/ansible]
└─$ ansible web -m user -a "name=date state=present"
192.168.26.13 | CHANGED => {
"ansible_facts": {
"discovered_interpreter_python": "/usr/bin/python"
},
"changed": true,
"comment": "",
"create_home": true,
"group": 1003,
"home": "/home/date",
"name": "date",
"shell": "/bin/bash",
"state": "present",
"system": false,
"uid": 1003
}
192.168.26.14 | CHANGED => {
"ansible_facts": {
"discovered_interpreter_python": "/usr/bin/python"
},
"changed": true,
"comment": "",
"create_home": true,
"group": 1003,
"home": "/home/date",
"name": "date",
"shell": "/bin/bash",
"state": "present",
"system": false,
"uid": 1003
}
┌──[root@zabbixserver]-[/ansible]
└─$ ansible web -m user -a "name=liruilong state=present"
192.168.26.13 | CHANGED => {
"ansible_facts": {
"discovered_interpreter_python": "/usr/bin/python"
},
"changed": true,
"comment": "",
"create_home": true,
"group": 1004,
"home": "/home/liruilong",
"name": "liruilong",
"shell": "/bin/bash",
"state": "present",
"system": false,
"uid": 1004
}
192.168.26.14 | CHANGED => {
"ansible_facts": {
"discovered_interpreter_python": "/usr/bin/python"
},
"changed": true,
"comment": "",
"create_home": true,
"group": 1004,
"home": "/home/liruilong",
"name": "liruilong",
"shell": "/bin/bash",
"state": "present",
"system": false,
"uid": 1004
}
┌──[root@zabbixserver]-[/ansible]
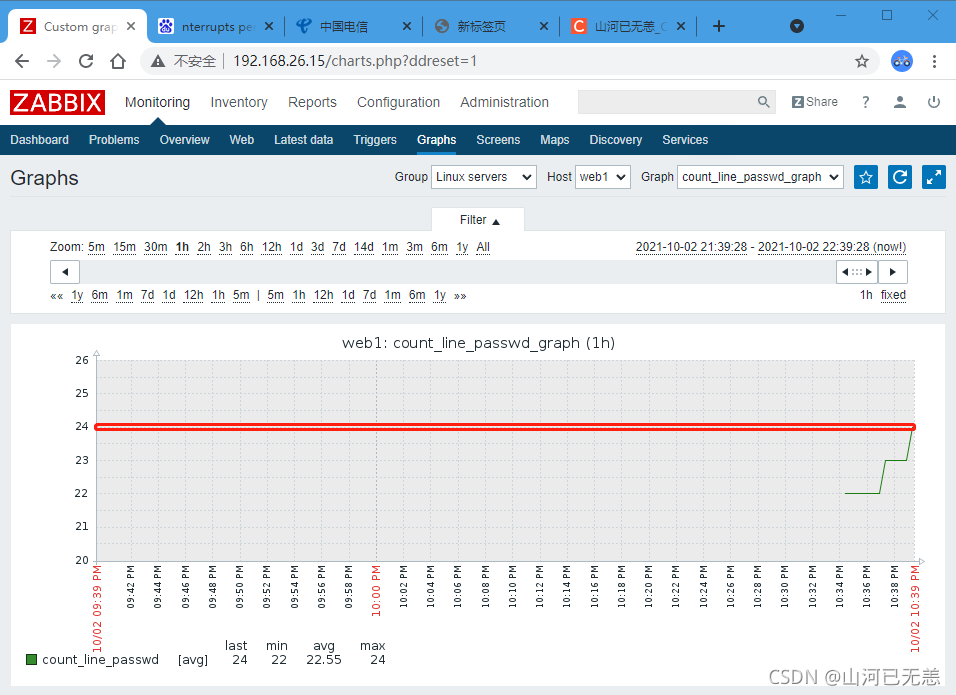
└─$ ansible web -m shell -a "zabbix_get -s 127.0.0.1 -k count.user"
192.168.26.14 | CHANGED | rc=0 >>
24
192.168.26.13 | CHANGED | rc=0 >>
24
┌──[root@zabbixserver]-[/ansible]
└─$
六、拓扑图与聚合图形
6.1 拓扑图
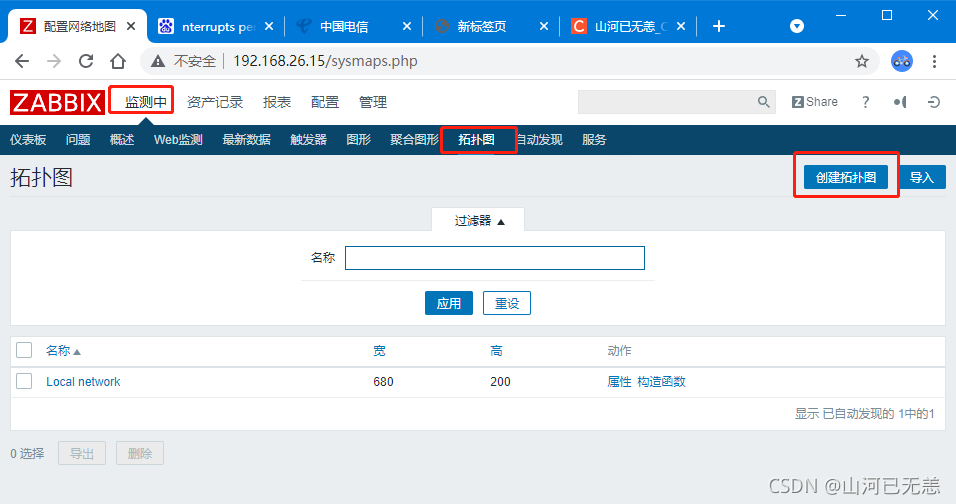
6.1.1 拓扑图
| 拓扑图 |
|---|
| 绘制拓扑图可以快速了解服务器架构 |
| Monitoring —> Maps (拓扑图) |
| 选择默认的 Local network 拓扑图,编写即 |
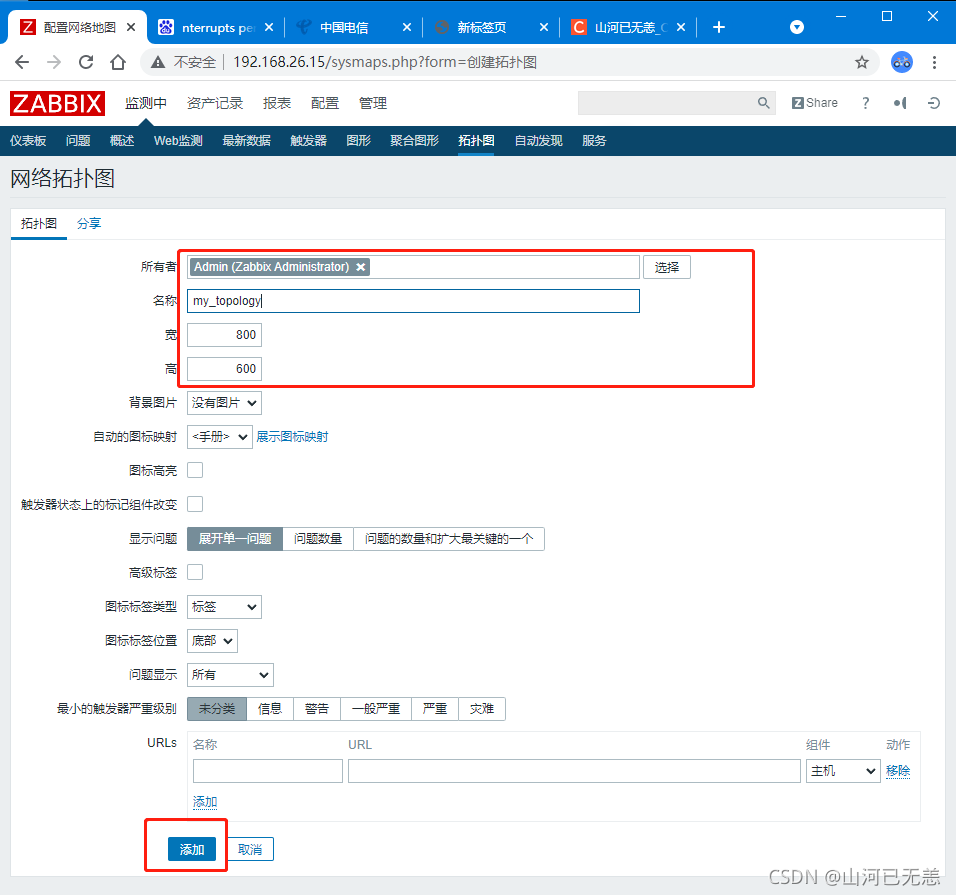
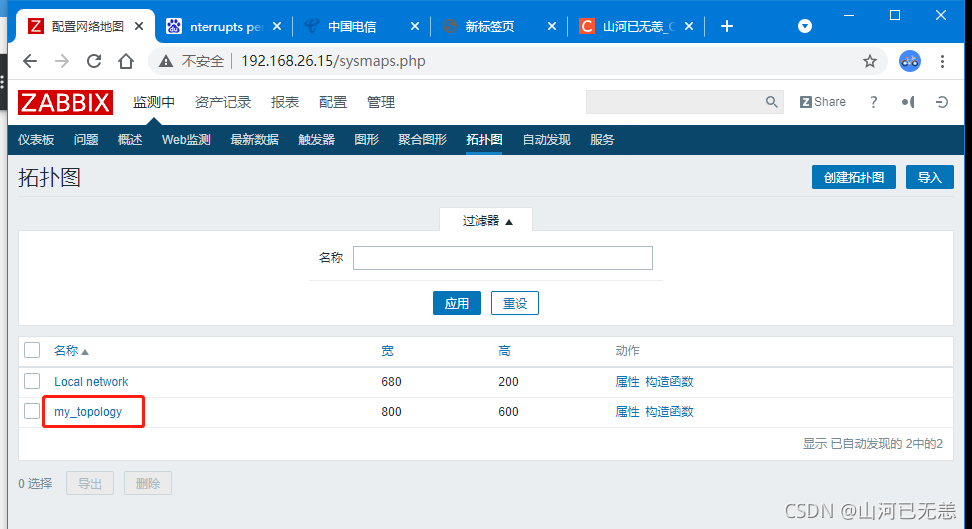
| 创建一个空的拓扑图 |
 |
| lcon(图标),添加新的设备后可以点击图标修改属性Shape(形状),Link(连线),先选择两个图标,再选择连线完成后,点击Update(更新) |
 |
 |
| 编辑拓扑图 |
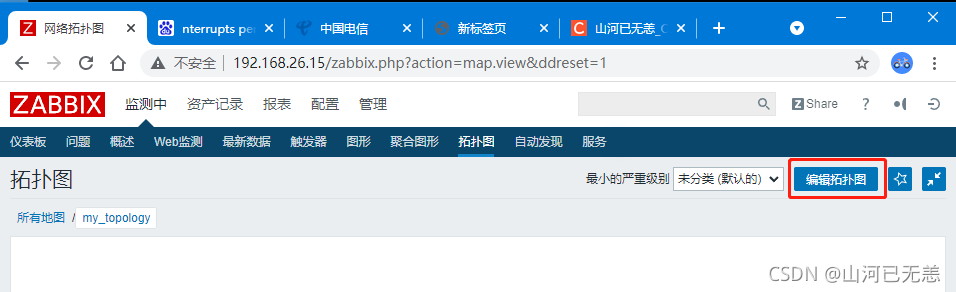 |
| :再次选择 ”添加“,点击”新的组件 |
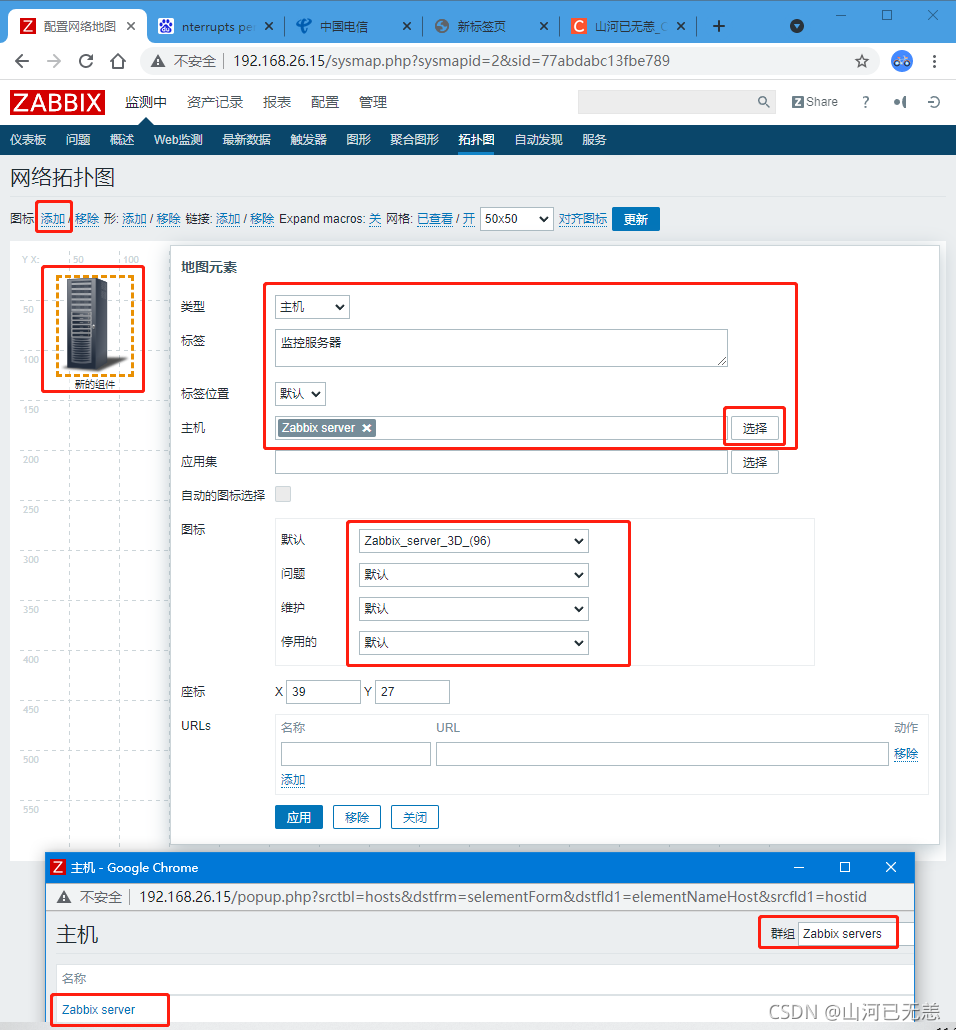 |
| 修改新组件的 ” 地图元素” |
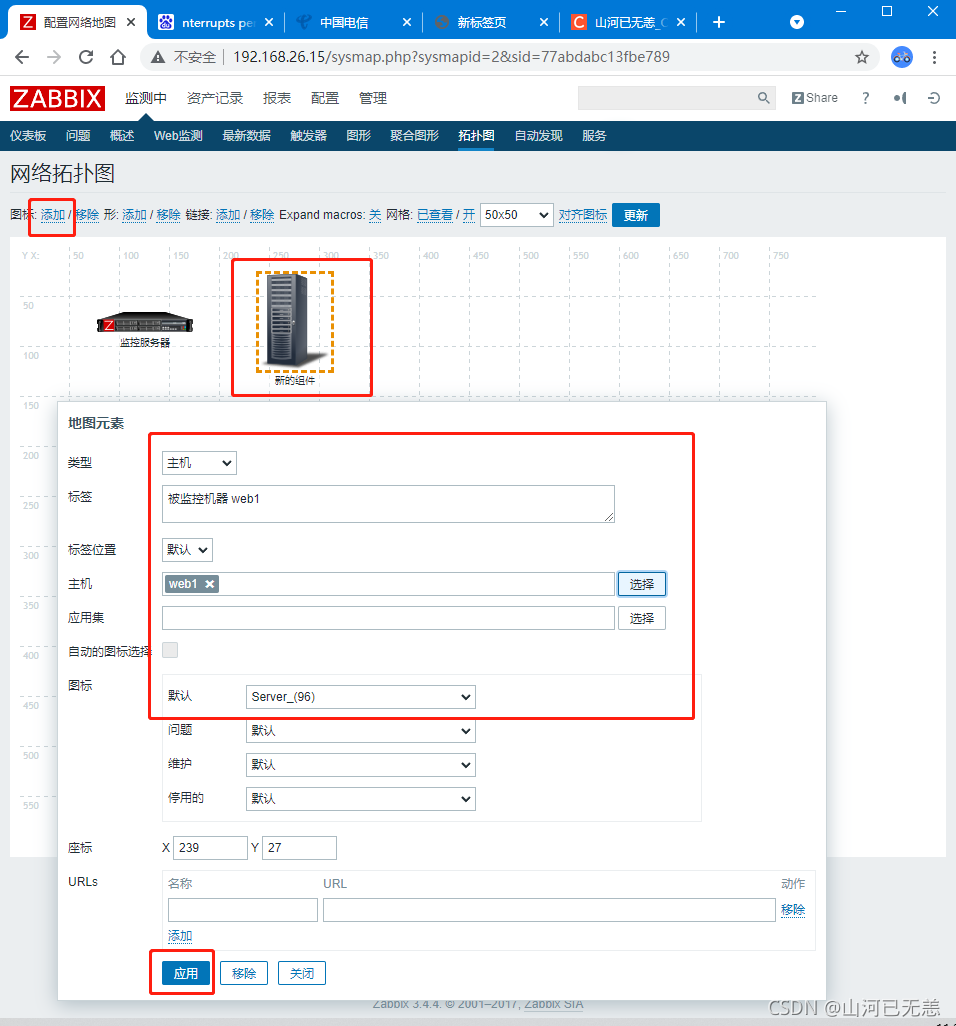 |
| 建立监控服务器与被监控主机web1的链接 |
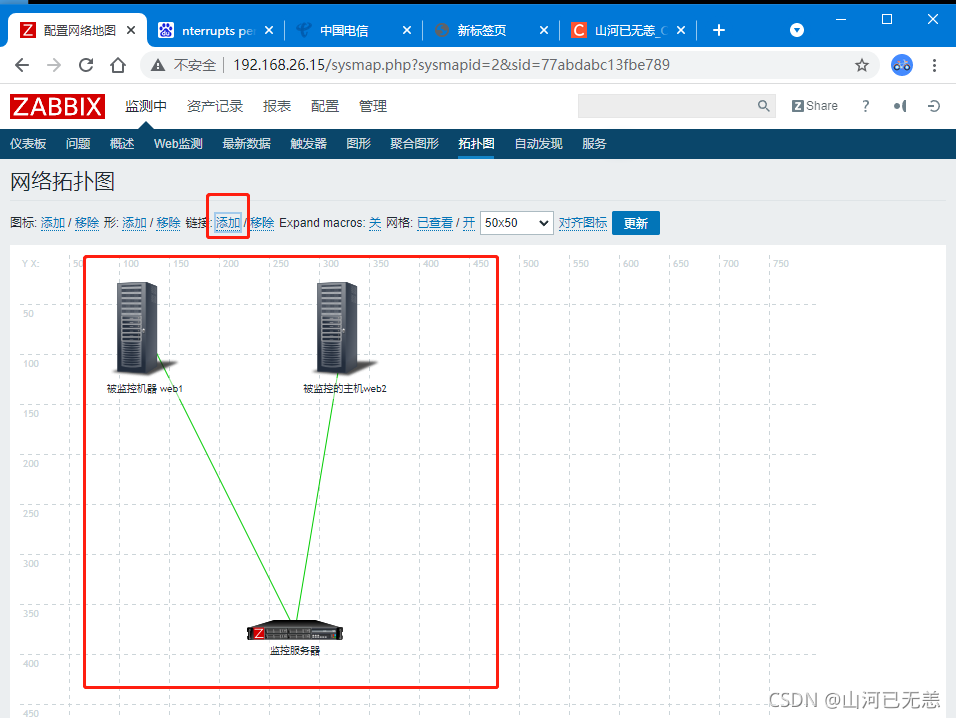 |
| 更新拓扑图 |
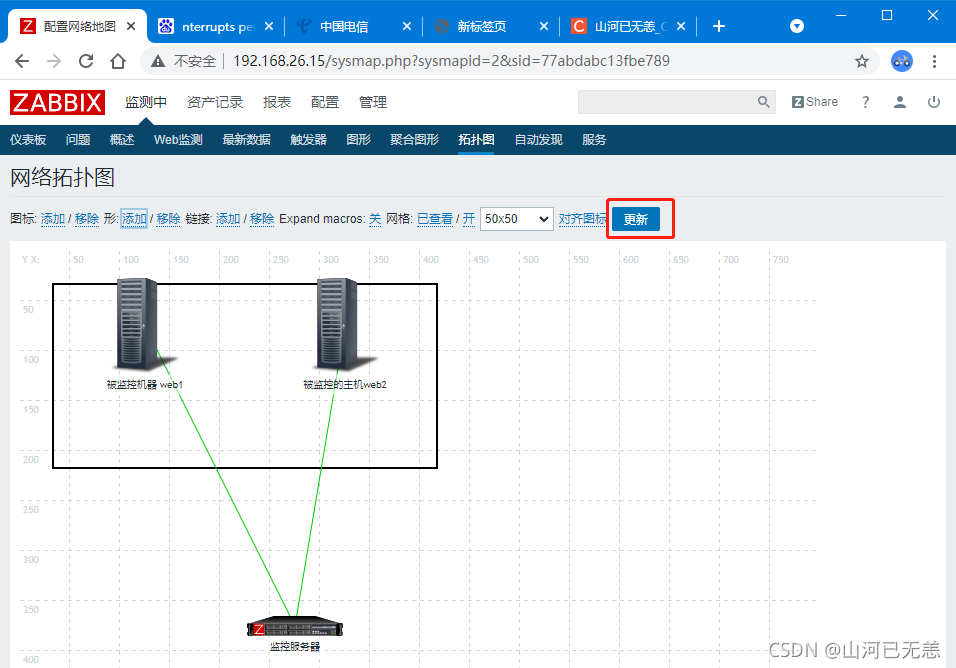 |
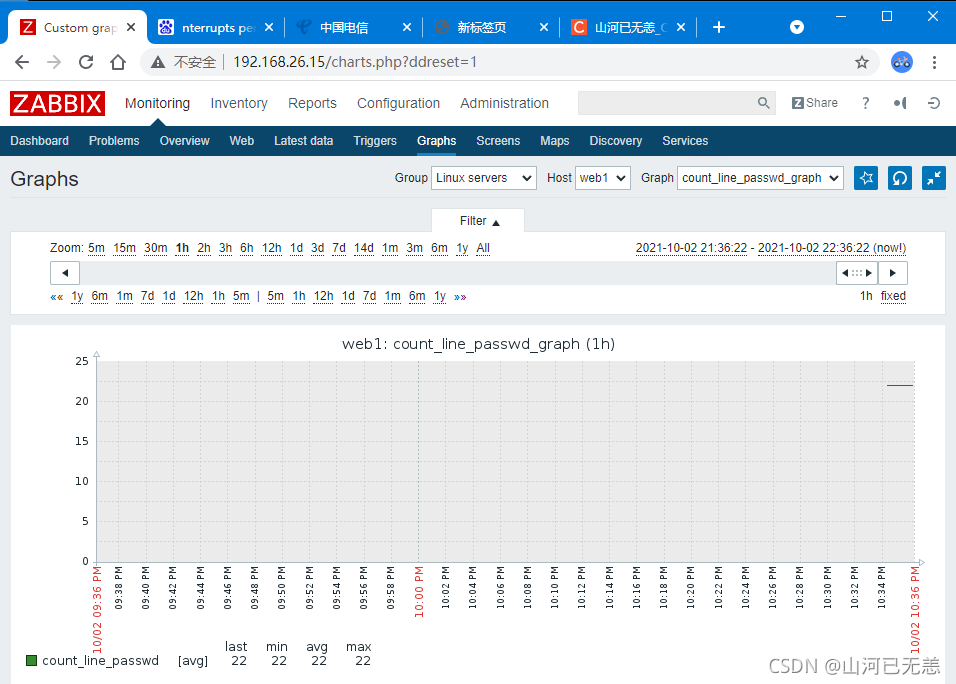
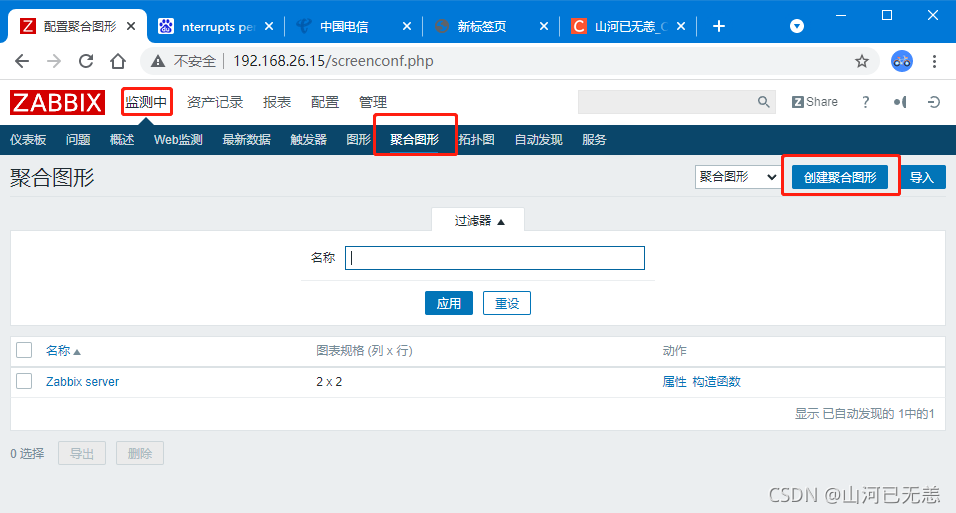
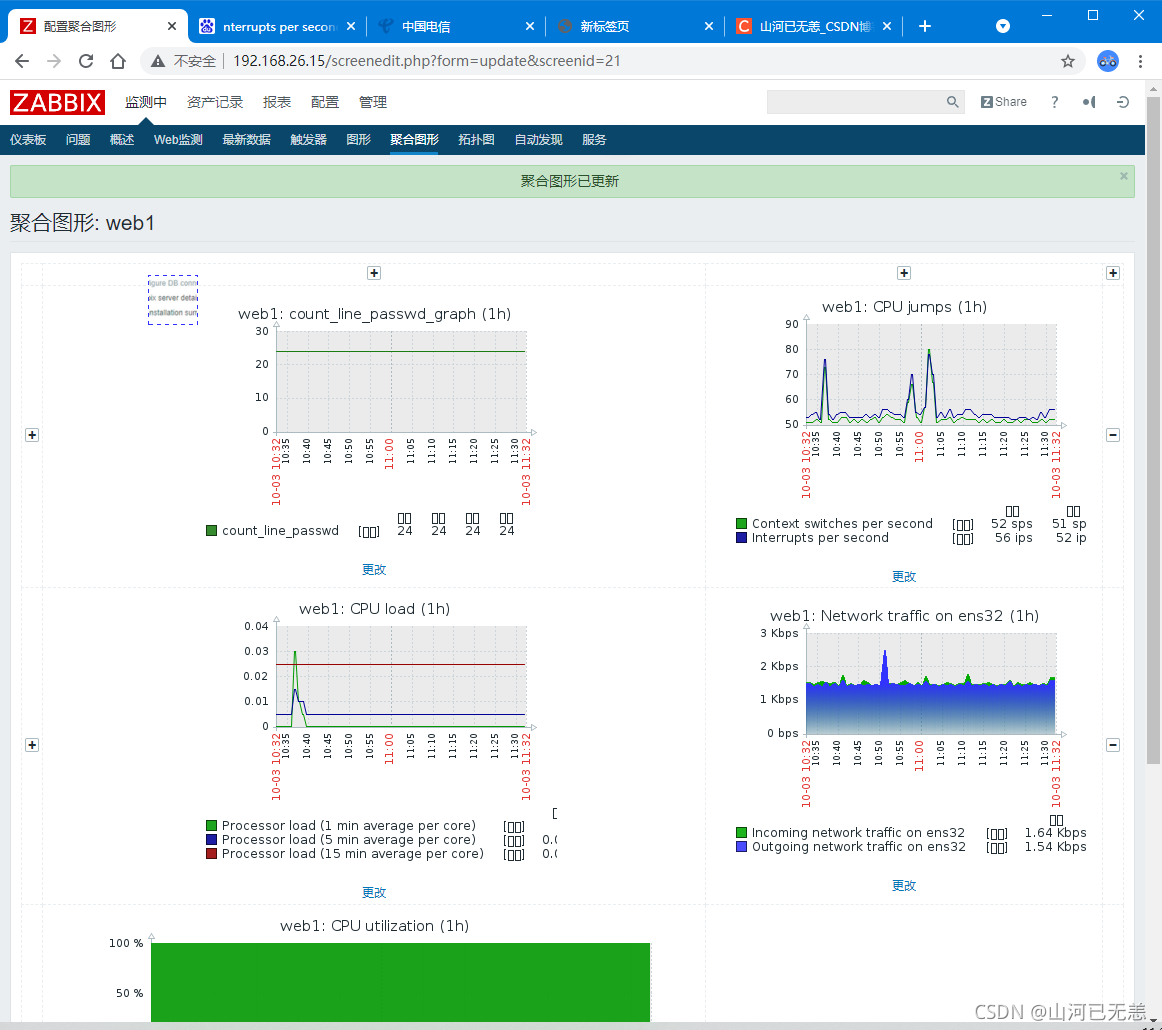
6.2 聚合图形
| 聚合图形 |
|---|
| 在一个页面显示多个数据图表,方便了解多组数据 |
| Monitoring —> Screens(聚合图形)—> Create screen |
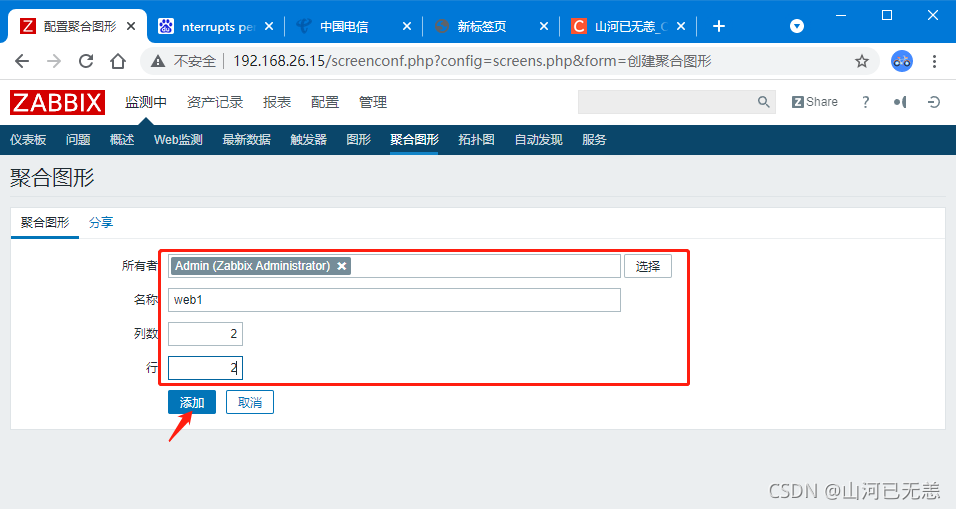
| Owner: 使用默认的Admin用户 |
| Name: 名称设置为 web1 |
| Columns: 列数设置为2列 |
| Rows: 行数设置为4行 |
| 第一步:选择“监控中”,选择“聚合图形”,选择“创建聚合图形” |
 |
 |
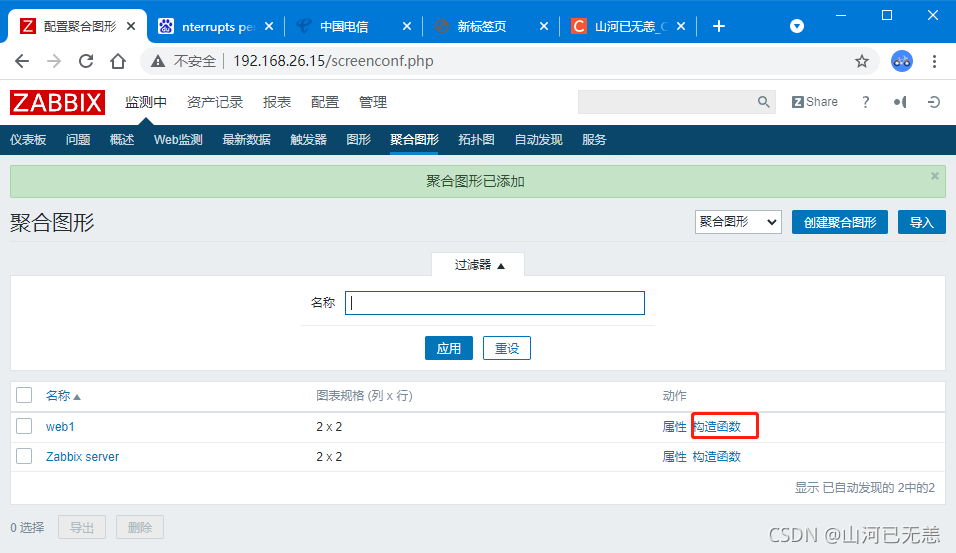
| 选择刚刚创建的聚合图形(web1),点击后面的构造函数(constructor),点击Change (更改),设置每行每列需要显示的数据图表,第一步:选择“监控中”,选择“聚合图形”,选择web后面的“构造函数” |
 |
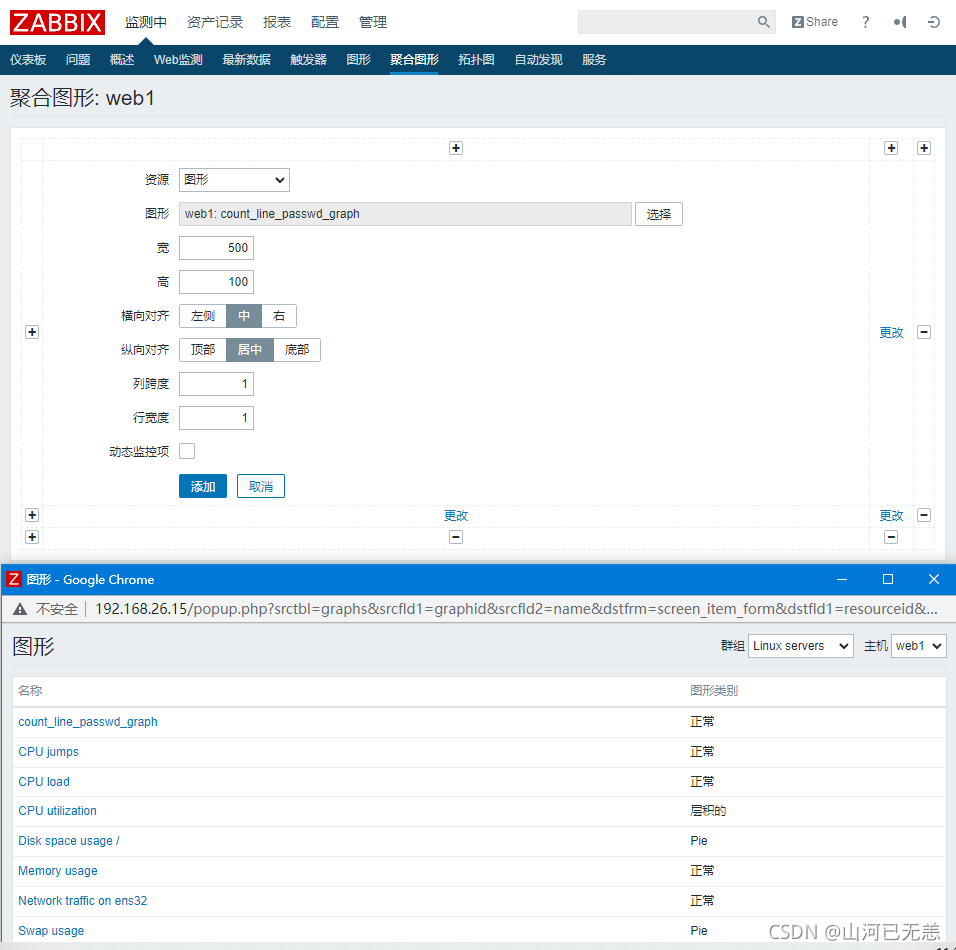 |
| 第二步:选择第二个 “更改”,配置图形数据,查看网卡信息 |
 |
七、自动发现
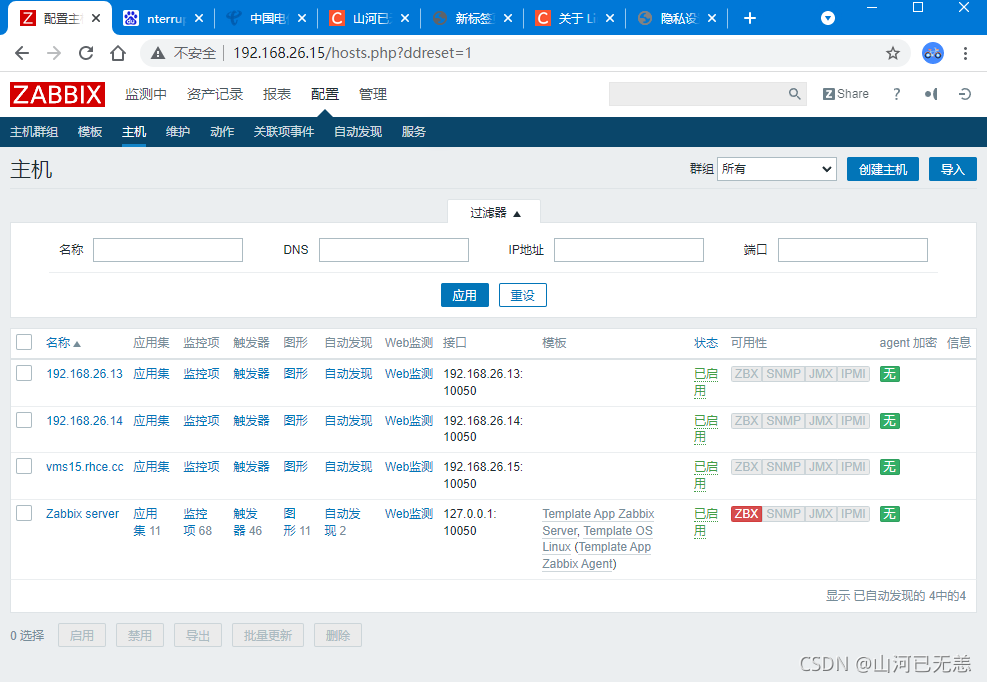
自动发现(Discovery):当Zabbix需要监控的设备越来越多,手动添加监控设备越来越有挑战,此时,可以考虑使用自动发现功能
自动发现可以实现:发现主机、添加主机、添加主机到组、链接模板等。
| 自动发现 |
|---|
| zabbix自动发现我们需要监控的目标主机; |
| zabbix自动的把这台主机添加到监控的主机列表中; |
| zabbix自动将目标主机加入到特定的组中; |
| zabbix自动为目标主机链接模板; |
| 自动发现(Discovery)流程 |
|---|
| 创建自动发现规则 |
| 创建 Action 动作(发现主机后自动执行什么动作) |
| 通过动作,执行添加主机,链接模板到主机等操作 |
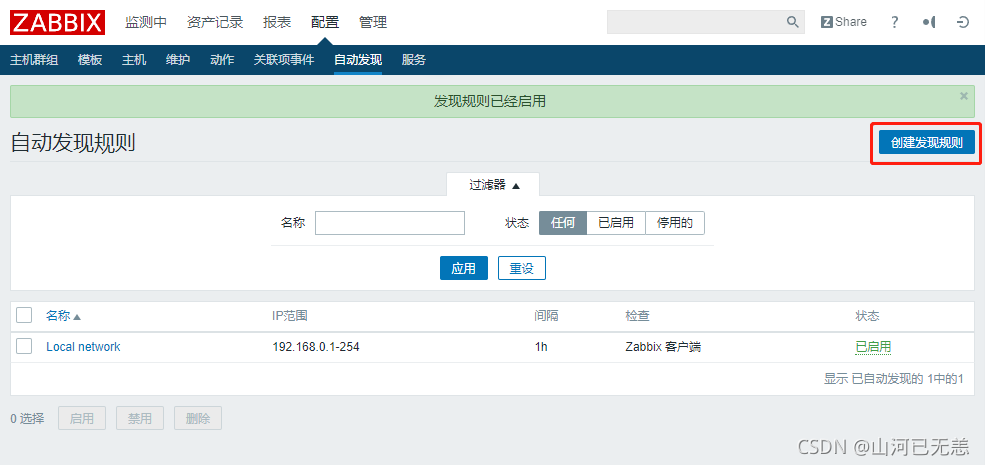
7.1 自动发现规则
| 创建自动发现规则 |
|---|
| Configuration —> Discovery —> Create discovery rule |
| 第一步:选择“配置”,选择“自动发现”,选择“创建自动发现规则” |
 |
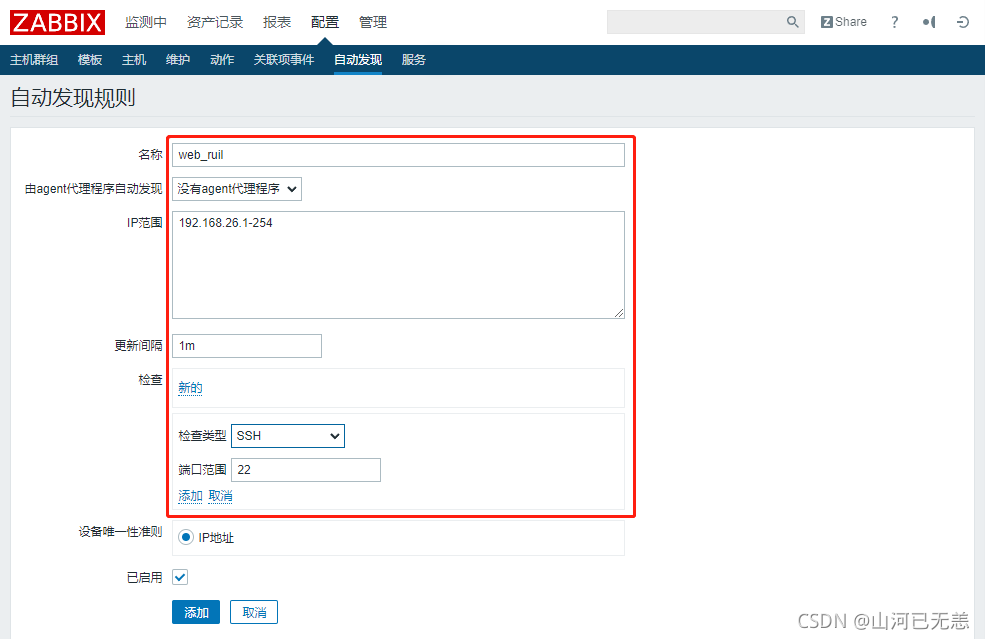
| 【名称】 #任意定义 |
| 【IP范围】 #设置自动发现的主机IP范围,不同IP以逗号作为分隔; |
| 【更新间隔】 #每隔多长时间扫描一次被监控主机,1h为正常开发环境参数,1m为实验环境参数; |
| 【检查】 #选择根据什么服务来发现目标主机; |
| 填写规则 |
| 自动发现的IP范围(逗号隔开可以写多个) |
| 多久做一次自动发现 |
| (默认为1小时,仅实验修改为1m) |
| 【名称】 #任意定义 |
| 【IP范围】 #设置自动发现的主机IP范围,不同IP以逗号作为分隔; |
| 【更新间隔】 #每隔多长时间扫描一次被监控主机,1h为正常开发环境参数,1m为实验环境参数; |
| 【检查】 #选择根据什么服务来发现目标主机; |
| 检查的方式: |
| HTTP、FTP、Agent的自定义key等检查 |
 |
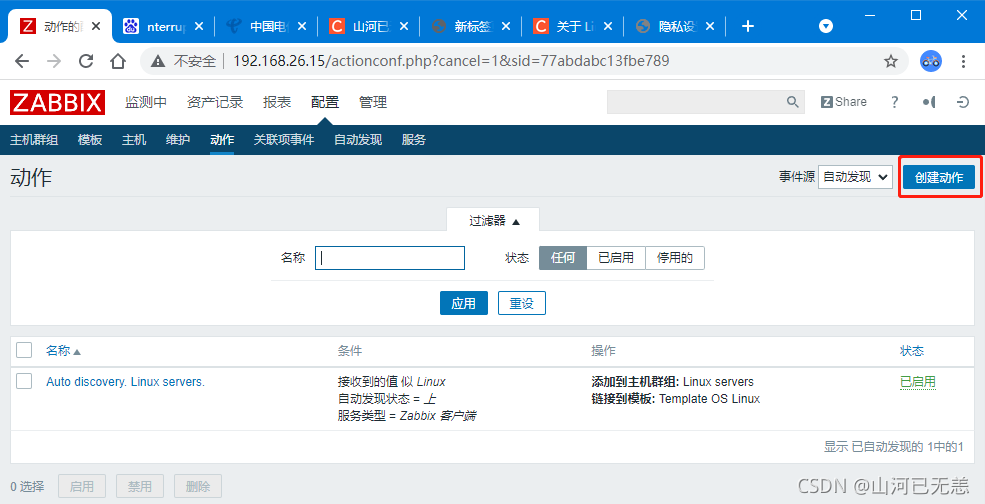
7.2 创建动作
| 创建动作 |
|---|
| Configuration —> Actions |
| Event source(Discovery) —> Create action |
| 注意:选择事件源为:自动发现 |
| 第一步:选择“配置”,选择“动作”,事件源选择“自动发现”,选择“创建动作” |
 |
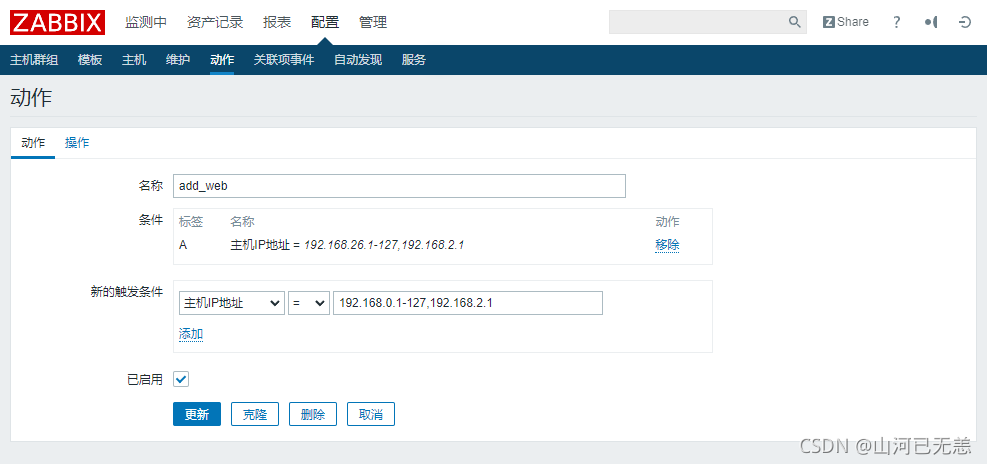
| 添加动作名称,添加触发动作的条件 |
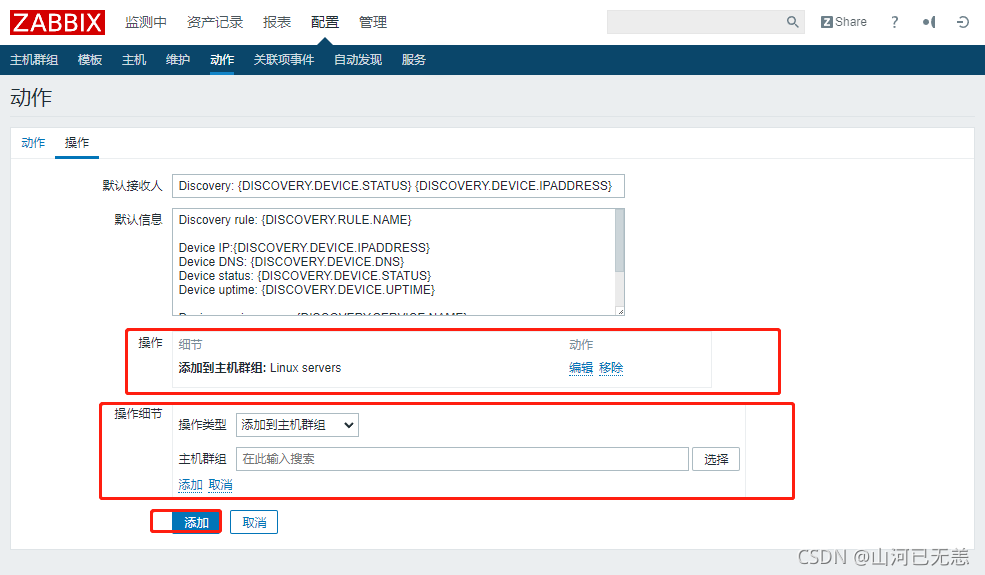
| 操作(触发动作后要执行的操作指令),操作细节如下: |
| 添加主机到组,与模板链接(HTTP模板) |
| 第二步:添加动作“名称”,选择“新的触发条件” (进一步过滤要发现的主机),选择“添加” |
 |
 |
 |
八、监控触发器
8.1 基本概念
| 基本概念 |
|---|
| 自定义的监控项默认不会自动报警 |
| 首页也不会提示错误 |
| 需要配置触发器与报警动作才可以自动报警 |
 |
| 动作(action) | 触发器(trigger) |
|---|---|
| 触发器的条件被触发后的行为 | 表达式,如内存不足300M,用户超过30个等; |
| 可以是发送邮件、也可以是重启某个服务等 | 当触发条件发生后,会导致一个触发事件; |
| 触发事件会执行某个动作; |
8.2 触发器
8.2.1 创建触发器
| 第二步:选择“Configuration”,选择"Templates", 选择对应模板后的“Triggers” |
 |
| 第三步:选择 “Create trigger”,创建触发器, |
| Expression表达式:触发异常的条件 |
{sserver>:<key>.<function>(<parameter>)}<operator><constant>住机: key.函数(参数)<表达式>常数 |
{web1:system.cpu.load[all, avg1].last(0)}>5 //0为最新数据如果web1主机最新的CPU平均负载值大于5,则触发器状态Problem |
{vfs.fs.size[/,free].max(5m)}<10G //5m为最近5分钟根分区,最近5分钟的最大容量小于10G,则状态进入Problem |
{fvis.file.cksum[/etc/passwd].diff(0)}>0 //0为最新数据,最新一次校验/etc/passwd如果与上一次有变化,则状态进入Problem |
| Expression表达式案例 |
| 大多数函数使用秒作为参数,使用#代表不同含义 |
| avg,count,last,min and max 函数支持额外的第二个参数time_shift (时间偏移量) |
| 这个参数允许从过去一段时间内引用数据。 |
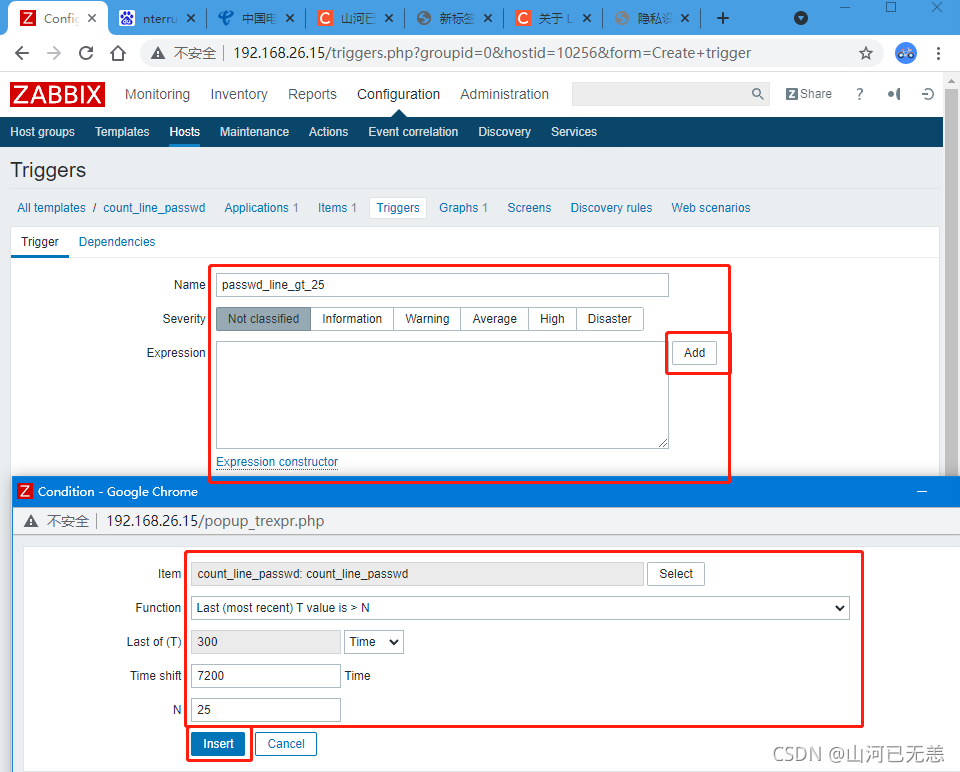 |
| 【Item】 #模板对应的监控项,对具体的监控项设置触发器 |
| 【Function】 #选择已经定义好的触发器表达式 |
| 【Last of(T)】 #最近多少时间内(秒),满足表达式,才会触发 |
| 【Time shift】 #指偏移量,取多长时间以前的监控数据,用于条件判断 |
| 针对模板【count_line_passwd】中的监控项【count_passwd_item】设置触发条件; |
| 使用函数判断:当监控到的最小值大于N(N=20)时,被触发; |
| 取7200秒(2小时)以前,向后再推移300秒的监控数据,用于触发条件判断; |
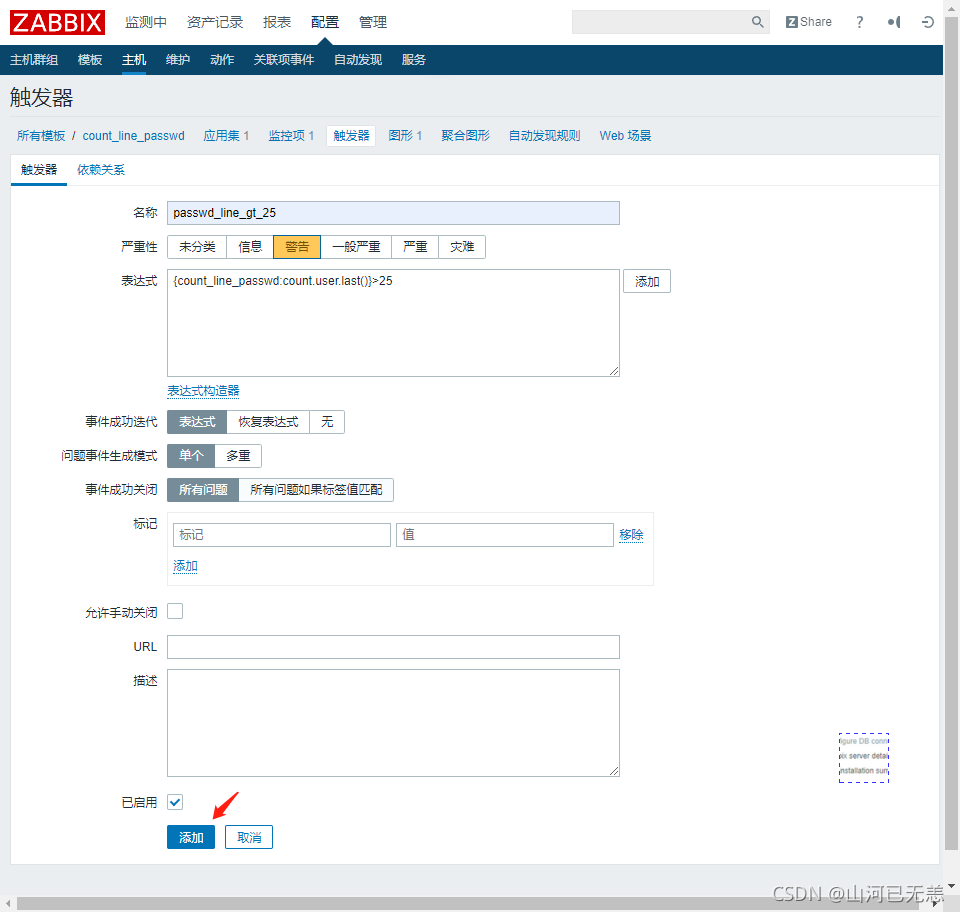 |
| 选择触发器报警级别,Add创建该触发器 |
九、报警邮件
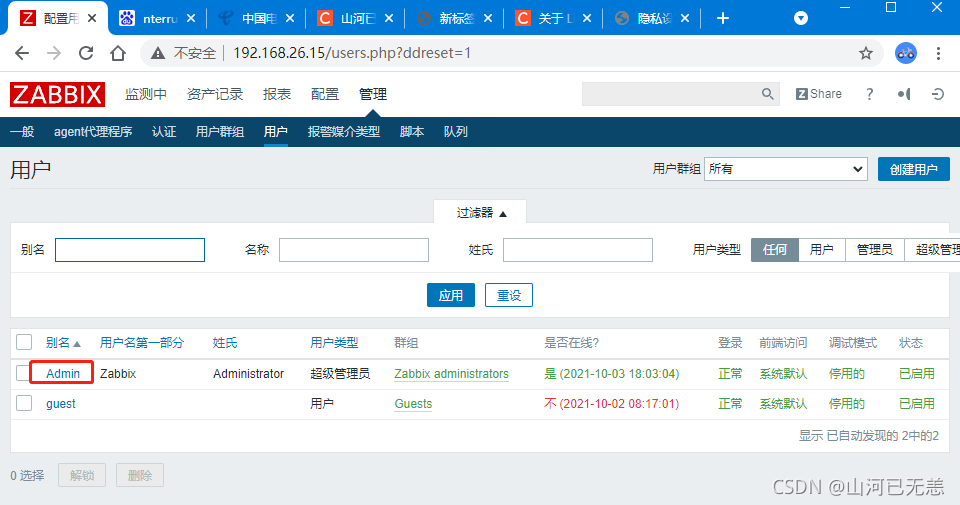
9.1 设置邮件
创建Media
| 设置邮件服务器 |
|---|
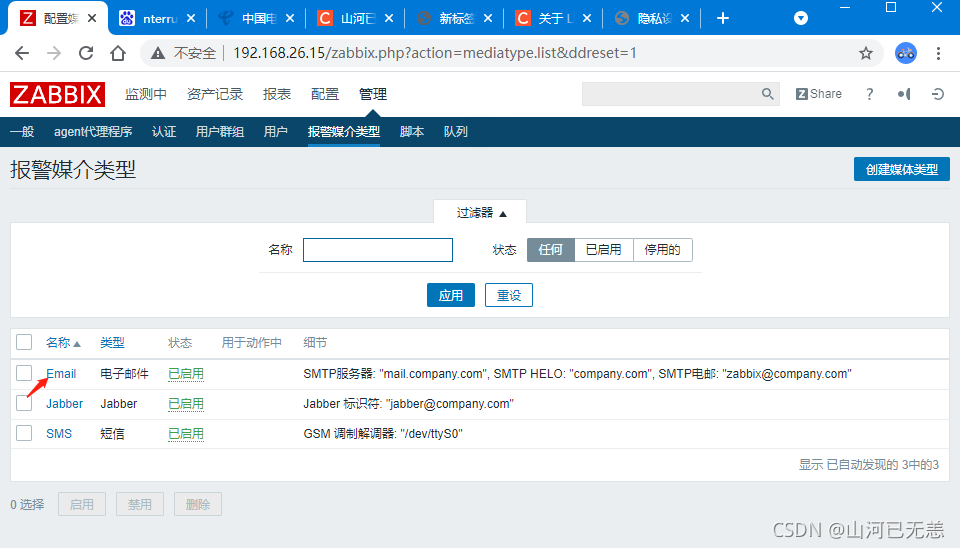
| Administration —> Media Type —> 选择Email邮件 |
| 设置邮件服务器信息 |
| 第一步:选择”管理“,选择”报警媒介类型“,点击”Email“电子邮件 |
 |
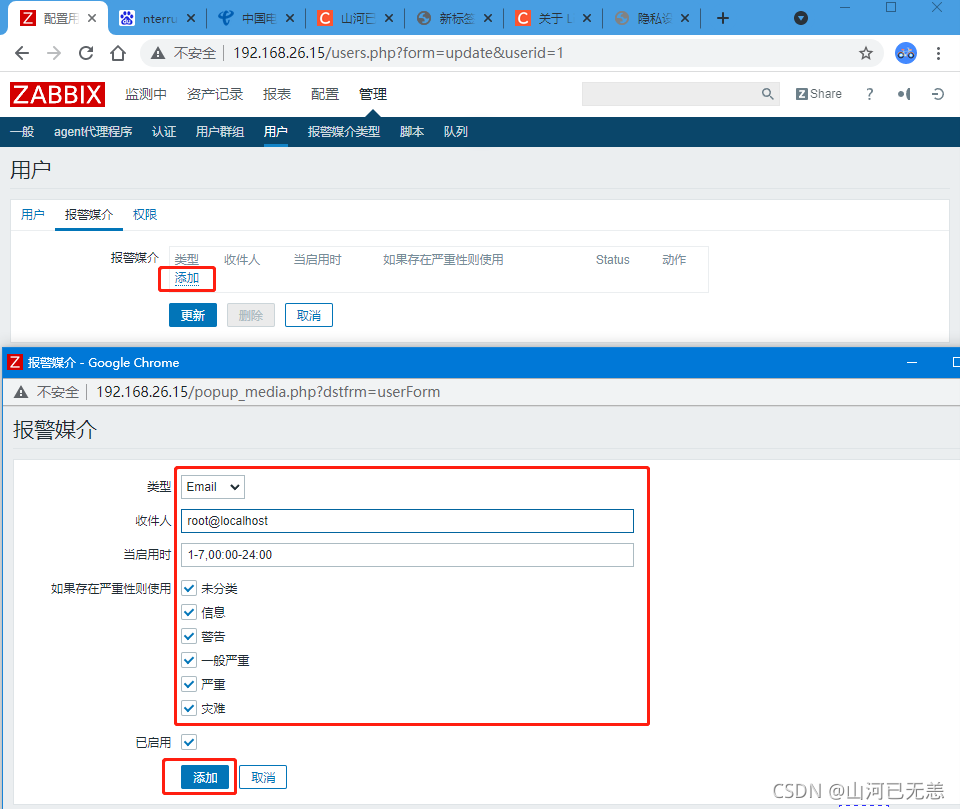
| 第二步:设置报警媒介 |
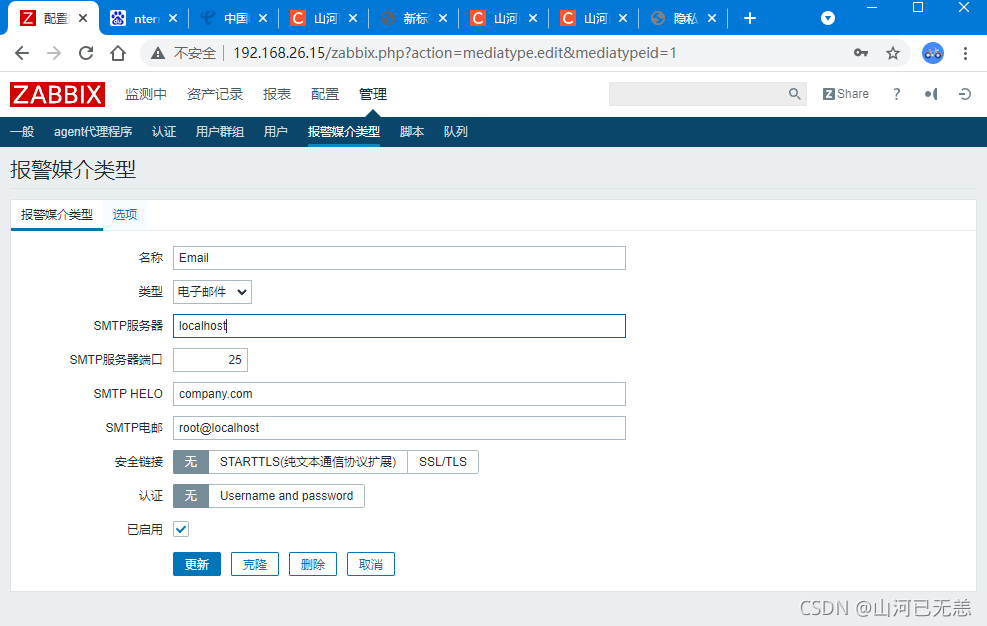 |
| 【名称】 #名称可以任意定义 |
| 【类型】 #选择”电子邮件“ 用于发送报警信息 |
| 【SMTP服务器】 #邮件服务器的地址,localhost指用本机作为邮件服务器 |
| 【SMTP服务器端口】 #邮件服务器的端口号,默认为25 |
| 【SMTP电邮】 #邮件服务器的账户,root作为邮件服务器的账户,localhost指本机 |
| 【安全链接】 #如果是发送到其他邮箱上(qq,163),需要选择对应的安全链接方式 |
| 【认证】 #用户名,密码 |
 |
| 选择Media菜单 —> 点击Add添加报警媒介 |
| 在Media Type中填写报警类型,收件人,时间等信息 |
| 第二步:给用户添加报警方式,”选择报警媒介“,选择 ”添加“ |
 |
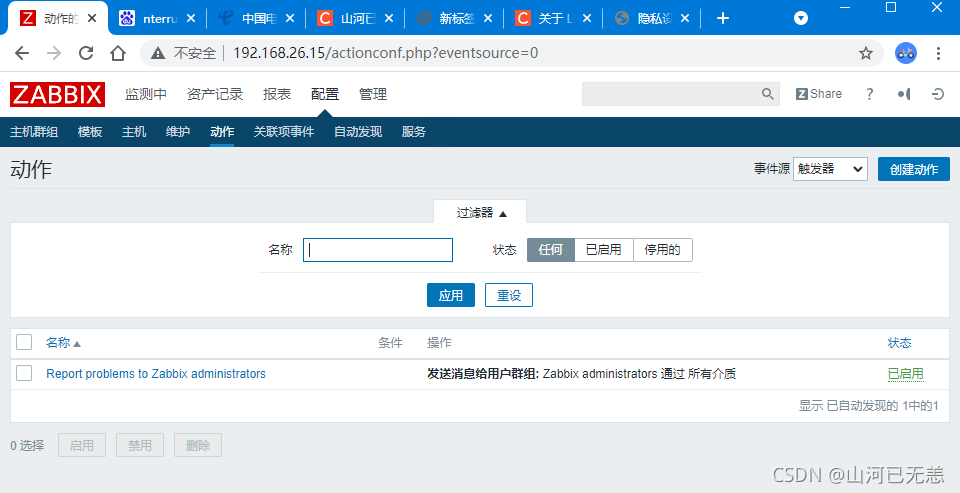
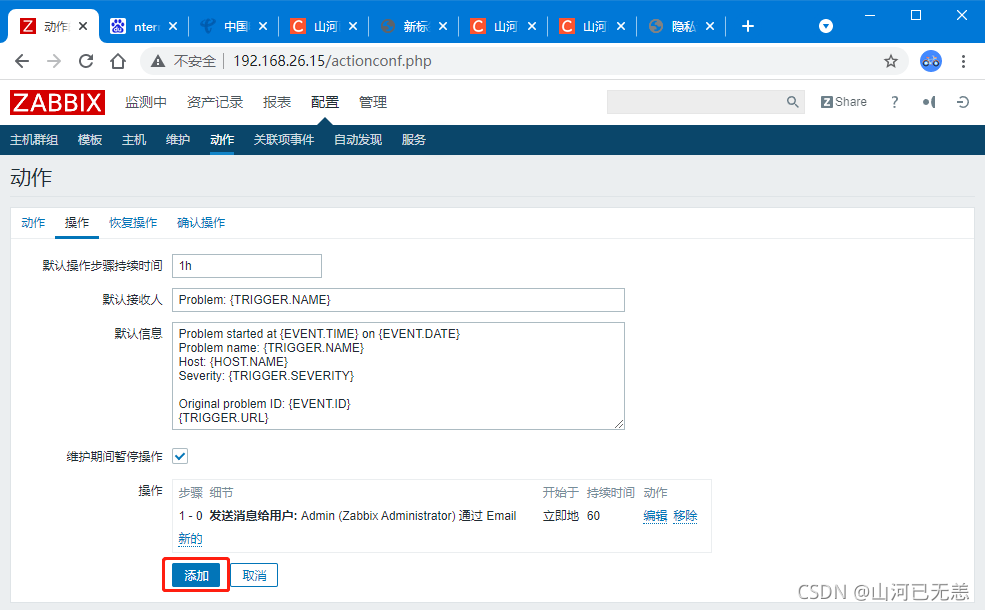
9.2 创建动作
| Action(行为) |
|---|
| 定义当触发器被触发时,执行什么Action |
| 通过Configuration —> Actions —> Create action 创建 |
| 选择 ”配置“, 选择”动作“, 选择"触发器" ,根据触发器来”创建动作“ |
 |
 |
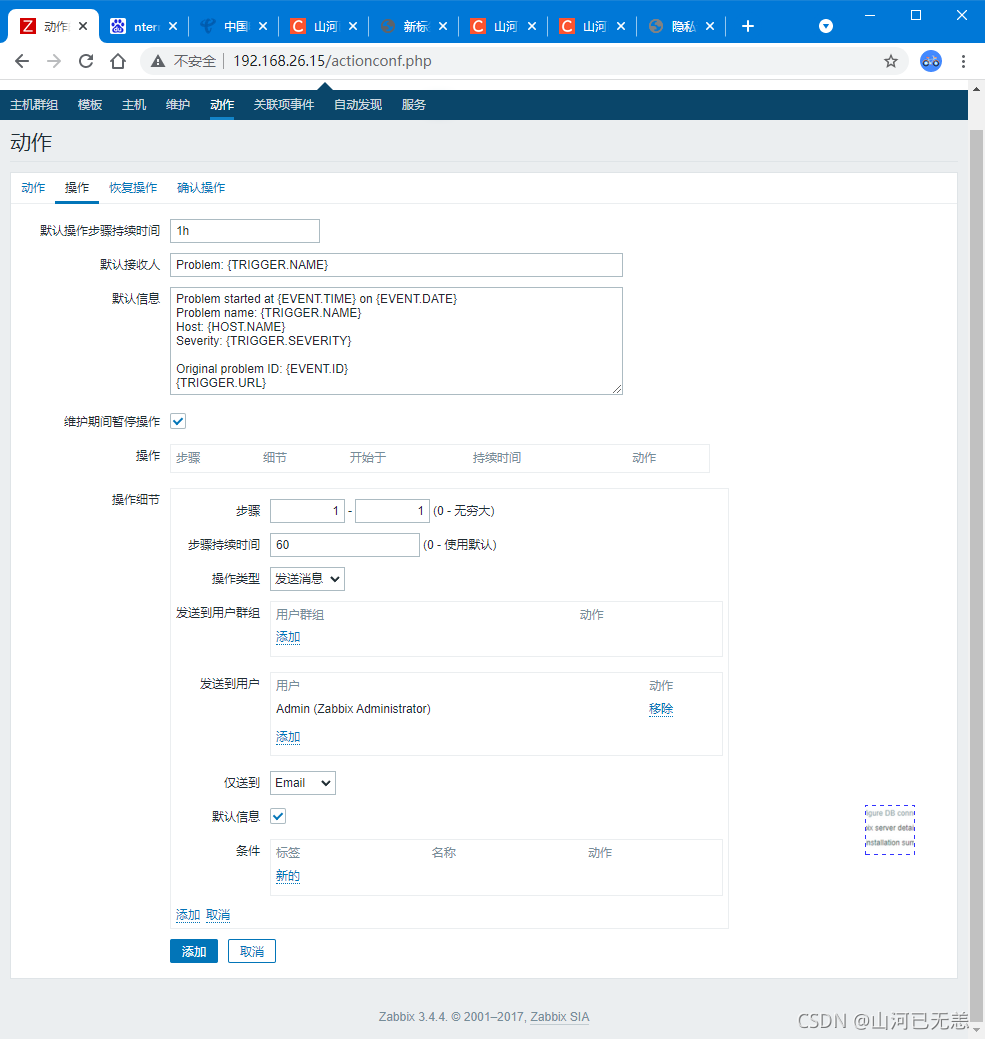 |
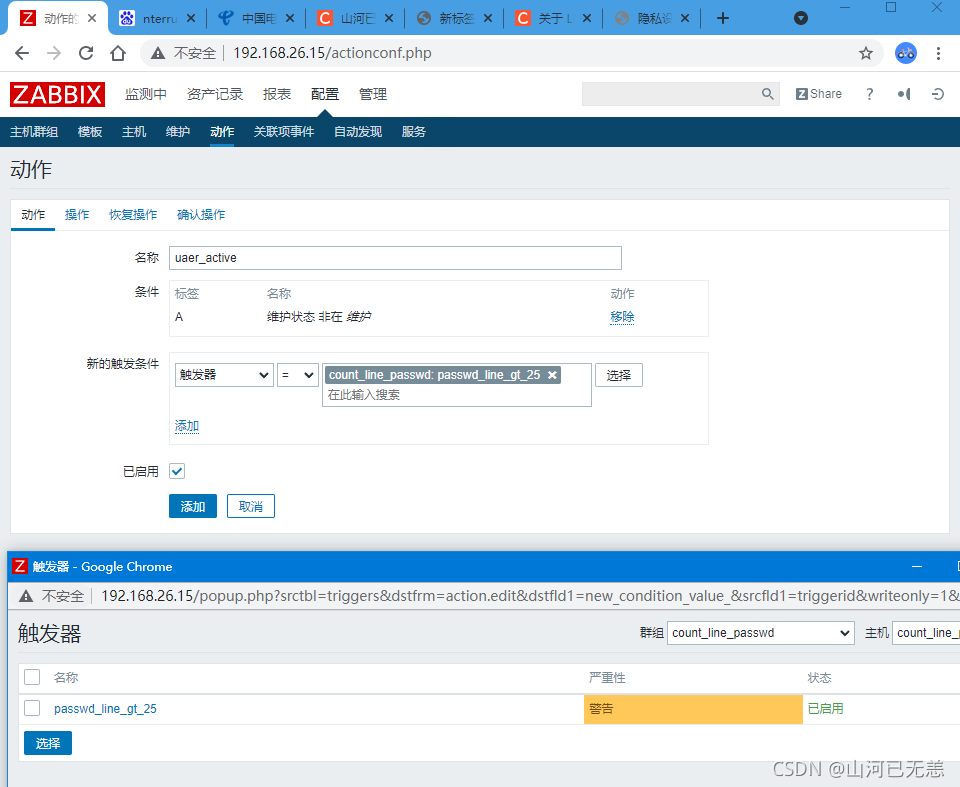
| 配置动作的具体操作行为(发送信息或执行远程命令) |
| 无限次数发送邮件,60秒1次,发送给Admin用户 |
| 【步骤】 #1 - 0 代表只要问题没有解决,就会一直发送报警邮件,1 - 10指只会发送最多10封报警邮件; |
| 【步骤持续时间】 #默认时间为秒,指每隔多长时间发送一次报警邮件; |
| 【发送到用户】 #将报警邮件发送给哪个用户,使用【添加】; |
| 【仅送到】 #选择Email,只采用邮件的发送方式,all指的是所有方式都用; |
 |
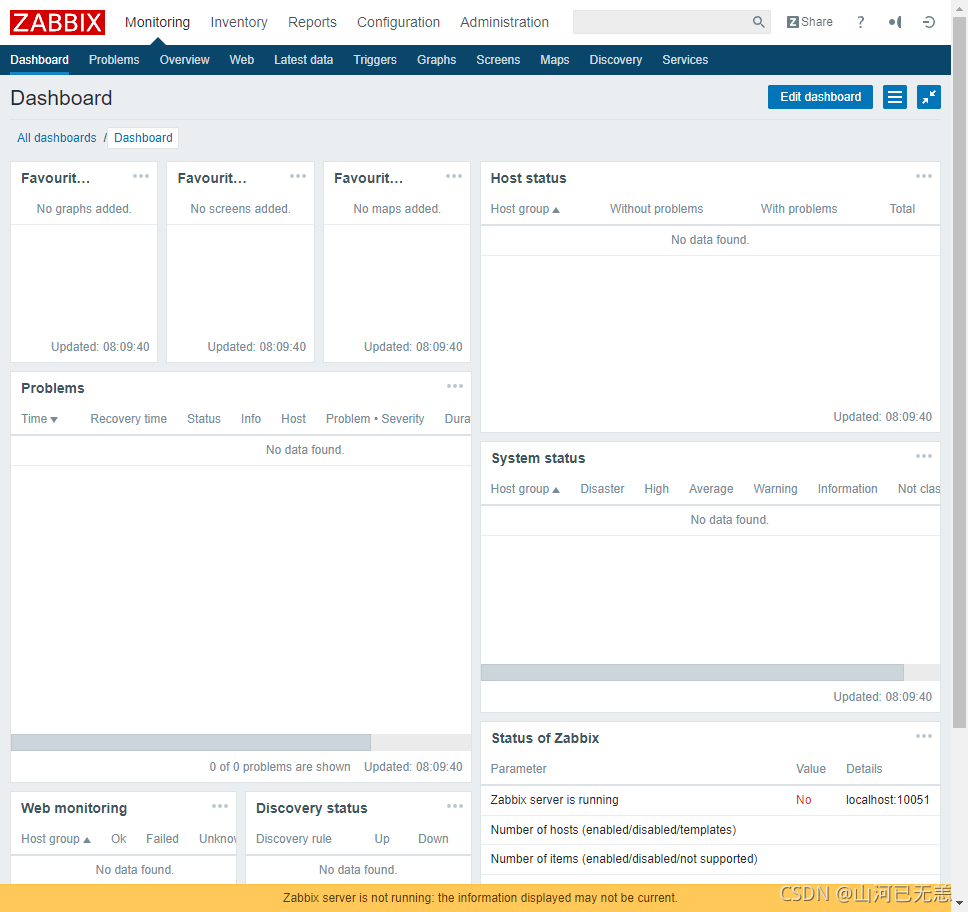
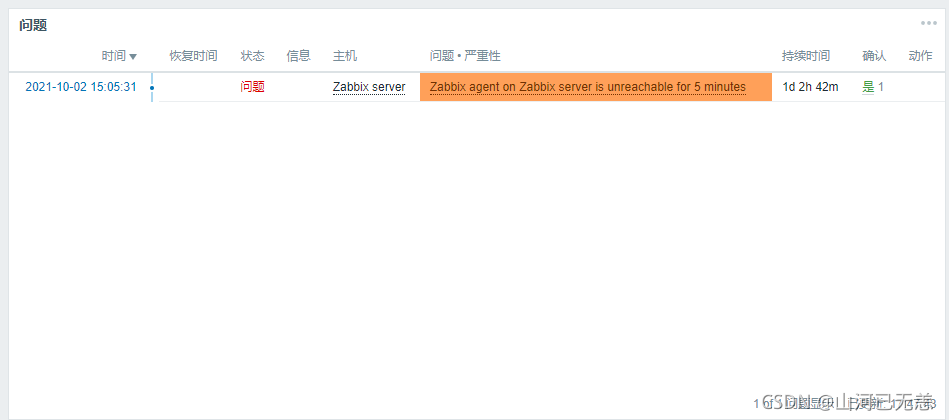
| 选择”监测中”, 选择 “仪表盘”,查看监控信息 |
 |
嗯,我這個沒有成功,時間關係,以後在研究,感興趣小夥伴可以研究下
十、主被动监控
1.1 概述
主动和被动都是对被监控端主机而言的
默认zabbix采用的是被动监控,当监控主机达到一定量级后,Zabbix服务器会越来越慢,此外,可以考虑使用主动监控,释放服务器的压力,另外,Zabbix 也支持分布式监控,也是可以考虑的方案
| 被动监控 | 主动监控 |
|---|---|
| 被动监控:Server向Agent发起连接 | 主动监控:Agent向Server发起连接 |
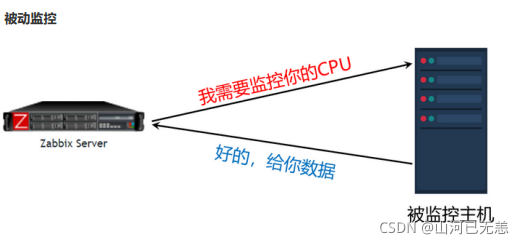 | 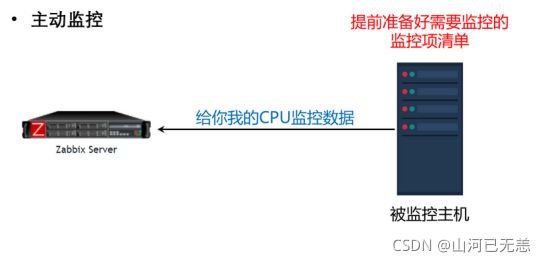 |
区别:Server 不用每次需要数据都连接Agent,Agent会自己收集数据并处理数据,Server仅需要保存数据即可