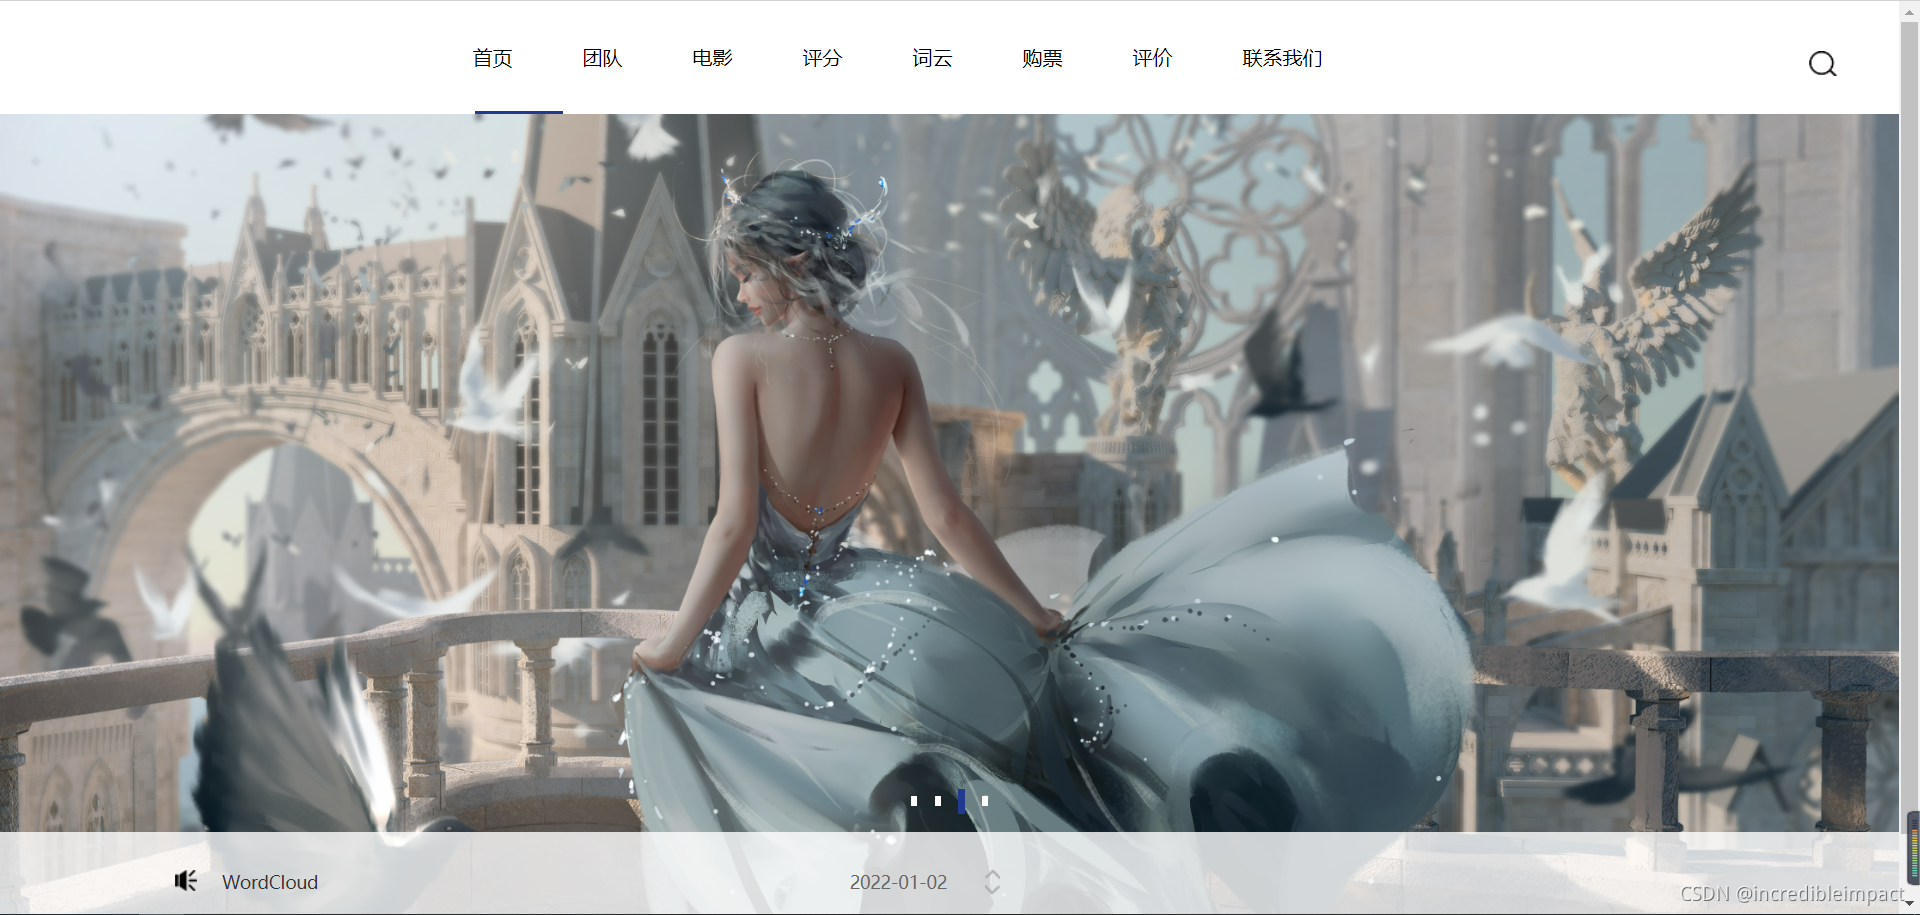
效果图


工具: Python,Flask,JS,CSS,HTML,WordCloud
爬取数据并存入数据库
一.导入需要的包
from bs4 import BeautifulSoup  # 网页解析,获取数据
import re  # 正则表达式,进行文字匹配
import xlwt  # 进行excel操作
import urllib.request, urllib.parse  # 指定URL,获取网页数据
import sqlite3  # 进行SQLite数据库操作
二.爬取网页数据
url=”网址”
(根据网址的规律,可以选择特定的页面,也可以应用循环读取不同的页面)
#如果网址含有中文则,则中文需要经过两次编码转换
#格式为 from urllib import parse   keyword= parse.quote(parse.quote("中文"))
#对请求的内容进行填充 (如果网址有反爬功能则需要填充,以模拟真实的浏览器)
head={“User-Agent”:… ; ….}
req = urllib.request.Request(url, headers=head)
html=””
#默认为发送get请求,如果要输入账户或cookie等则需要发送post请求,通过data = bytes(urllib.parse.urlencode({"xxx": "xxx"}), encoding="utf-8")传入数据即可
#获取网页源代码到response中(限定反应时间为3s),读取源代码到变量html,然后解析提提取数据
response=urlib.request.urlopen(req, [timeout=3],[ data=data])
html=response.read().decode(‘utf-8’) #这里根据网页的编码格式决定,F12即可查看soup=BeautifulSoup(html,”html.parser”)
data=[]
#提取信息方式一:F12定位得到你所需要的元素,逐层提取,如div.el  p.p1  span  a
link=soup.select(“.el>p1>span>a”)
data.append(link[“href”])   #link[“属性”]  link.text可以获取标签
#可以用strip()去除左右空白,用replace替换字符,用split划分字符串,用[切片]选择区域,[0:2]选择前两个字符,[0:-2]表示去掉最后两个字符
data.append({“link”:link[“href”]})
#提取信息方式二:
#1.得到网页中的div标签,class属性值为item的全部信息
#2.将得到的信息进一步筛选,需要先将item信息转化为字符串,通过定义的规则进行匹配,并保存起来,通过筛选之后可能也不止一个选项,但都会放到一个列表中,因此可以根据自身要求再度筛选
for item in soup.find_all(‘div’,class_=’item’):
item=(str)item
findLink=re.compile(r’<a href=”(.*?)”>) #正则表达式
link=re.findall(findLink,item) #while len(link)>1  link.remove()
link[0]=re.sub(‘<br(\s+)?/>(\s+)?’,””,link[0]) #根据规则去除空白匹配,strip()函数可以去掉左右两边的空白
data.append(link[0])
三.保存数据
保存到excel->创建工作书,在工作书中添加表格,编辑表格内容,将工作书保存到路径中
book=xlwt.Workbook(encoding=”utf-8”)
sheet=book.add_sheet(‘Sheet’[,cell_overwrit_ok=True]) #允许同一个格子进行重写
sheet.write(0,0,data[0])
book.save(“我的文档.xls”)
#保存到SQLite->获取链接,获取游标,用游标执行sql语句,提交链接,关闭连接
con=sqlite3.connect(“MyWord.db”)
cur=con.cursor()
sql=’’’
create table table1
(id integer primary key autoincrement,
word text)
‘’’
cur.execute(sql)
con.commit()
sql=”insert into table1(word) values(“%s”)”%data[0]
cur.execute(sql)
con.commit()
con.close()
数据可视化Flask
from flask import Flask, render_template
app=Flask(__name__)
@app.route(‘/index/<String : str>’)
def index(str):
#可以写入sqlite语句,然后将得到的数据传入html中
#传入html的数据有可能因为转移字符出现问题
#如双引号”会变成',因此在html页面中使用{{s|tojson}}
return render_template(“index.html”,s=str)
if __name__==’__main__’:
app.run()
html代码问题及解答
问题一:图片加载出错
解决:路径出错,使用../在全路径下寻找
问题二:图片受css影响导致简单地修改图片尺寸无法奏效
解决:在头部添加<style> .样式名字{height:650px !important}</style>
问题三:跳转连接时无法回到根目录
解决:使用/team会直接返回/team页面,使用team返回的是在所在页面后面加/team
Echarts的使用
#头部引入echars.js文件
<script src="../static/js/echarts.min.js"></script>
#在需要防止图标的位置为echars准备一个具备大小的DOM
<div id="main" style="width: 1200px;height: 600px;">
</div> <script type="text/javascript">
    #基于准备好的dom,初始话echarts实例
    var myChart=echarts.init(document.getElementById('main'));
    #此处插入在官网中找到的实例代码
    #使用刚指定的配置项和数据显示图表。
    myChart.setOption(option);
    </script>
WordCloud的使用
import jieba
import wordcloud as wordcloud
from matplotlib import pyplot as plt
from wordcloud import WordCloud
from PIL import Image
import numpy as np
import sqlite3
#创建数据库连接并把数据保存到字符串变量中  代码略
#结巴分词得到很多词的列表->将列表的词都连接起来,此时词与词直接有空格->
#打开遮罩图片->将图片转化为数组->指定词云格式->指定字符串->绘制图片->生成图片
cut = jieba.cut(text)
string=’  ’.join(cut)
img = Image.open(r'.\static\img\p6.jpg')
img_array = np.array(img)
wc = WordCloud(
    background_color='white',
    mask=img_array,
    # C:Windows/Fonts 选择字体
    font_path="STZHONGS.TTF"
)
wc.generate_from_text(string)
fig = plt.figure(1)  # 从第一个位置开始绘图
plt.imshow(wc)  # 按照wc的规则绘图
plt.axis('off')  # 显示坐标轴
plt.savefig(r'.\static\img\p8.png', dip=800)  # 保存图片到文件 dpi指清晰度
声明:学习资源来自Python爬虫编程基础5天速成(2021全新合集)Python入门+数据分析_哔哩哔哩_bilibili