本文章开始讲述基于Matlab绘制箭头,主要包括一下函数:
annotation :annotation(lineType,x,y) 创建一个在当前图窗中的两个点之间延伸的线条或箭头注释。将 lineType 指定为 ‘line’、‘arrow’、‘doublearrow’ 或 ‘textarrow’。将 x 和 y 分别指定为 [x_begin x_end] 和 [y_begin y_end] 形式的二元素向量。quiver:quiver(X,Y,U,V) 在由 X 和 Y 指定的笛卡尔坐标上绘制具有定向分量 U 和 V 的箭头。例如,第一个箭头源于点 X(1) 和 Y(1),按 U(1) 水平延伸,按 V(1) 垂直延伸。默认情况下,quiver 函数缩放箭头长度,使其不重叠。quiver3:quiver3(X,Y,Z,U,V,W) 在由 X、Y 和 Z 指定的笛卡尔坐标处,绘制具有定向分量 U、V 和 W 的箭头。例如,第一个箭头源于点 X(1)、Y(1) 和 Z(1),根据 U(1) 在 x 轴方向延伸,根据 V(1) 在 y 轴方向延伸,并根据 W(1) 在 z 轴方向延伸。默认情况下,quiver3 函数缩放箭头长度,使其不重叠。✦ 二维箭头
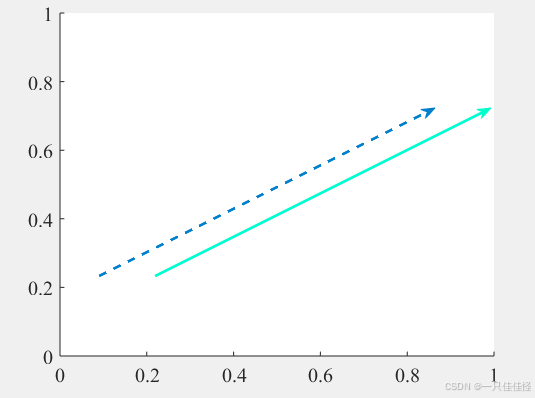
调整箭头的大小、颜色和线型使用 annotation 和 quiver 函数时,可以设置箭头的颜色、线型、头部大小等参数
figure;% 使用 annotation 绘制箭头ah1 = annotation('arrow', [0.2, 0.8], [0.3, 0.7]);hold onah1.Color = [0, 0.5, 0.8]; % 设置箭头颜色ah1.LineWidth = 2; % 设置箭头线宽ah1.HeadLength = 10; % 设置箭头头部长度ah1.HeadWidth = 10; % 设置箭头头部宽度ah1.LineStyle = '--'; % 设置箭头线型ah2 = annotation('arrow', [0.3, 0.9], [0.3, 0.7]);hold onah2.Color = [0, 1, 0.8]; % 设置箭头颜色ah2.LineWidth = 2; % 设置箭头线宽ah2.HeadLength = 10; % 设置箭头头部长度ah2.HeadWidth = 10; % 设置箭头头部宽度ah2.LineStyle = '-'; % 设置箭头线型hold off;set(gca,'FontSize',15,'FontName','Times New Roman');结果:
2. 双向箭头
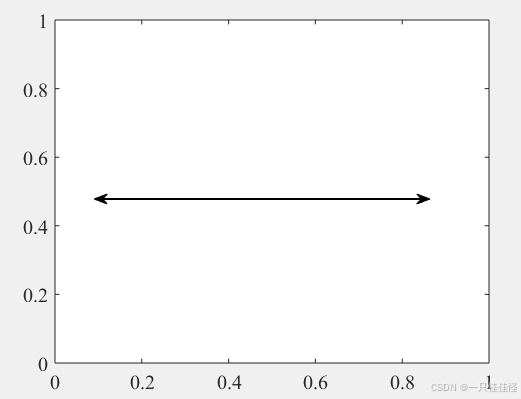
可以使用 doublearrow 类型在 annotation 中创建双向箭头。
figure;hold on;% 使用 annotation 绘制双向箭头annotation('doublearrow', [0.2, 0.8], [0.5, 0.5], 'Color', [0, 0, 0], 'LineWidth', 1.5);hold off;box onset(gca,'FontSize',15,'FontName','Times New Roman');结果:
3. 可以使用 doublearrow 类型在 annotation 中创建双向箭头。
使用 quiver 绘制多个箭头(用于矢量场或风场图)
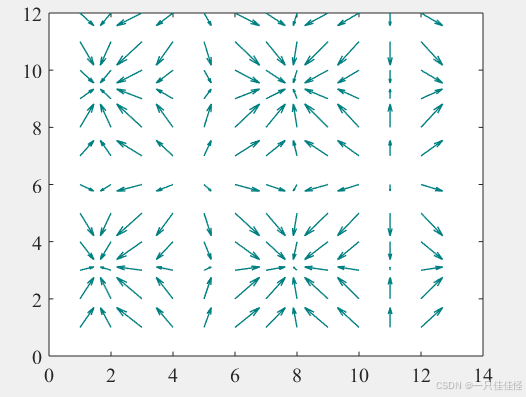
quiver 函数可以用来在图中绘制多个箭头,这对于显示矢量场非常有用。
figure;[X, Y] = meshgrid(1:12, 1:12);U = cos(X); % X 方向上的矢量V = sin(Y); % Y 方向上的矢量quiver(X, Y, U, V, 'LineWidth', 1, 'MaxHeadSize', 0.5, 'Color', [0, 0.5, 0.5]);box onset(gca,'FontSize',15,'FontName','Times New Roman');结果:
4. 使用 textarrow 增加带文本的箭头
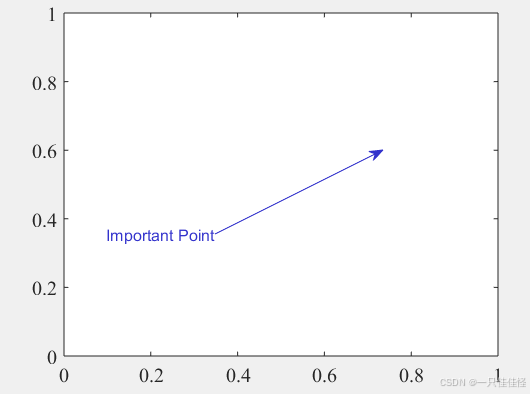
在图形上标记特定点或趋势时,可以使用 textarrow 将文本和箭头组合起来。
figure;% 使用 annotation 绘制带文本的箭头th = annotation('textarrow', [0.4, 0.7], [0.4, 0.6], 'String', 'Important Point');th.FontSize = 12; % 设置文本大小th.Color = [0.2, 0.2, 0.8]; % 设置箭头颜色hold off;box onset(gca,'FontSize',15,'FontName','Times New Roman');结果:
✦ 三维箭头
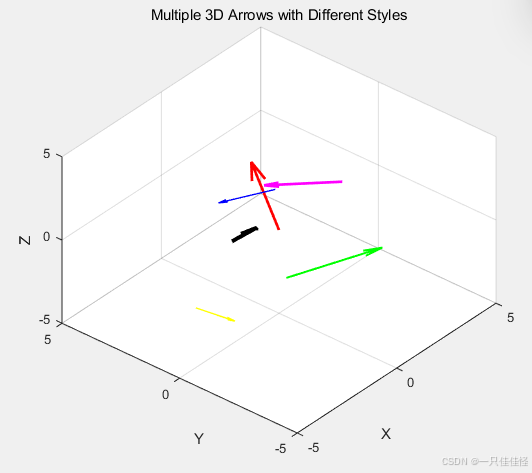
% 创建一个新的图形窗口figure;hold on;% 设置坐标轴范围axis([-5 5 -5 5 -5 5]);% 设置三维视角view(3); % 设置为三维视角,显示立体效果% 添加标签和标题xlabel('X');ylabel('Y');zlabel('Z');title('Multiple 3D Arrows with Different Styles');% 启动网格grid on;% 第一种箭头样式: 红色,线宽2,头部大小1quiver3(0, 0, 0, 2, 3, 1, 'Color', 'r', 'LineWidth', 2, 'MaxHeadSize', 1);% 第二种箭头样式: 蓝色,线宽1,头部大小0.5quiver3(1, 1, 1, -2, 1, 0, 'Color', 'b', 'LineWidth', 1, 'MaxHeadSize', 0.5);% 第三种箭头样式: 绿色,线宽1.5,头部大小0.7quiver3(-2, -2, 0, 3, -2, 1, 'Color', 'g', 'LineWidth', 1.5, 'MaxHeadSize', 0.7);% 第四种箭头样式: 品红色,线宽2,头部大小0.8quiver3(2, -1, 2, -2, 2, 0, 'Color', 'm', 'LineWidth', 2, 'MaxHeadSize', 0.8);% 第五种箭头样式: 黑色,线宽3,头部大小1.2quiver3(0, 2, -2, -1, -2, 3, 'Color', 'k', 'LineWidth', 3, 'MaxHeadSize', 1.2);% 第六种箭头样式: 黄色,线宽1,头部大小1quiver3(-3, 1, -3, 1, -1, -1, 'Color', 'y', 'LineWidth', 1, 'MaxHeadSize', 1);% 显示图形hold off;结果
