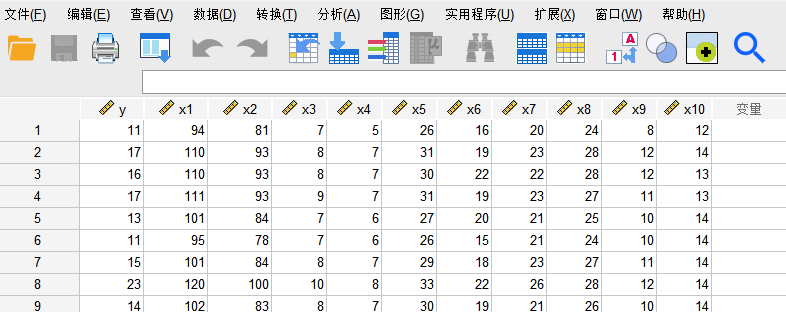
打开SPSS将数据输入到SPSS中。
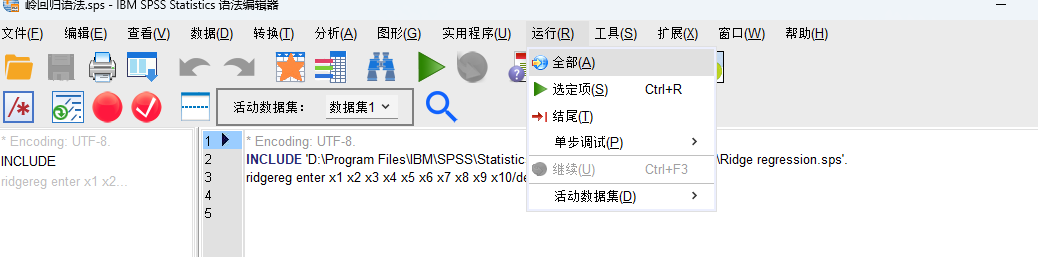
点击左上角文件->新建->语法

输入
* Encoding: UTF-8.INCLUDE 'D:\Program Files\IBM\SPSS\Statistics\27\Samples\Simplified Chinese\Ridge regression.sps'.ridgereg enter x1 x2 x3 x4 x5 x6 x7 x8 x9 x10/dep=y.include内容需要自己寻找,即Samples\Simplified Chinese\Ridge regression.sps路径下的Ridge regression.sps文件,根据自己的安装目录自行寻找。enter后填写岭回归自变量,dep为岭回归应变量。输入完毕后点击运行->全部。
点开查看器查看结果。
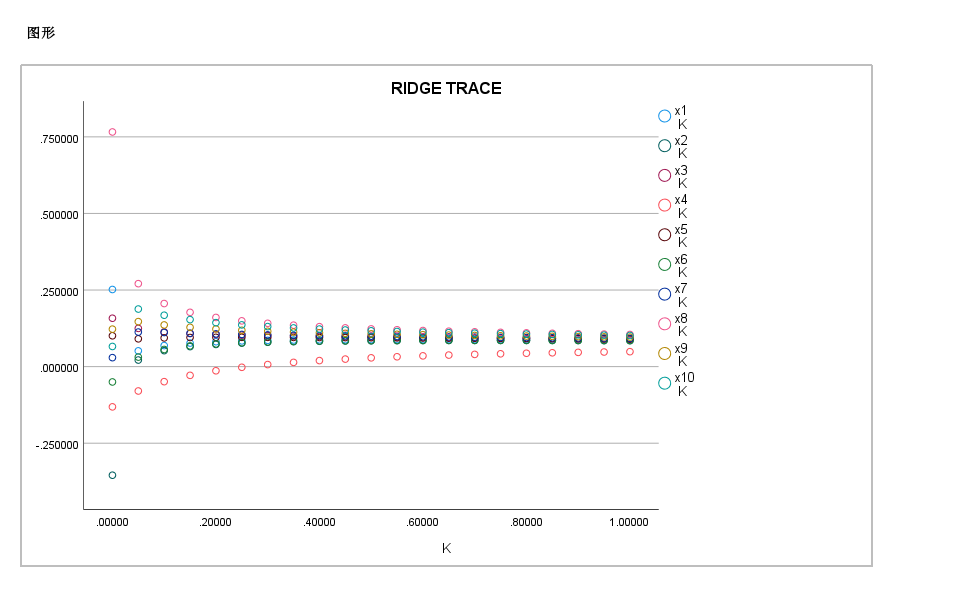
k值越小越好,选择趋于稳定的k值。可以看到k值在0.2-0.3之间就趋于稳定了,调到语法界面输入如下代码:
* Encoding: UTF-8.INCLUDE 'D:\Program Files\IBM\SPSS\Statistics\27\Samples\Simplified Chinese\Ridge regression.sps'.ridgereg enter x1 x2 x3 x4 x5 x6 x7 x8 x9 x10/dep=y/start=0/stop=0.3/inc=0.02.start表示岭迹图起点,stop表示岭迹图终点,inc表示横坐标间隔(0,0.02,0.04。。。)。
点击运行->全部
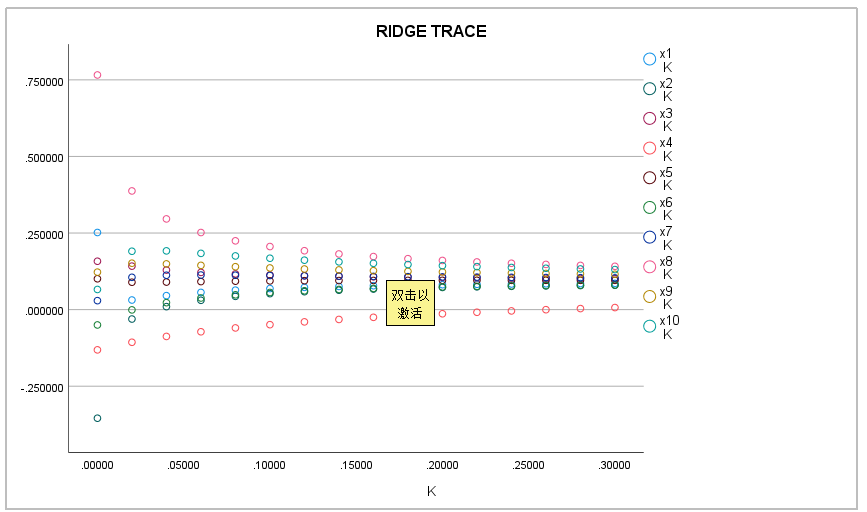
可以看到在0.08左右就趋于稳定了。(这个选择比较主观)然后回到语法界面修改语法如下:
* Encoding: UTF-8.INCLUDE 'D:\Program Files\IBM\SPSS\Statistics\27\Samples\Simplified Chinese\Ridge regression.sps'.ridgereg enter x1 x2 x3 x4 x5 x6 x7 x8 x9 x10/dep=y/k=0.08.点击运行->全部,打开查看器看结果

Rsquare即为r方,
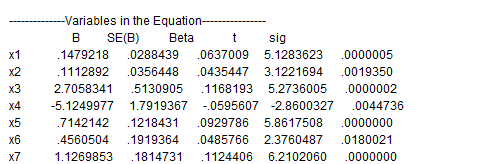
为变量前的参数

为常数项
注意:确定好了k值之后最好重启软件再输入语法
* Encoding: UTF-8.INCLUDE 'D:\Program Files\IBM\SPSS\Statistics\27\Samples\Simplified Chinese\Ridge regression.sps'.ridgereg enter x1 x2 x3 x4 x5 x6 x7 x8 x9 x10/dep=y/k=0.08.