该案例只做参考
步骤:
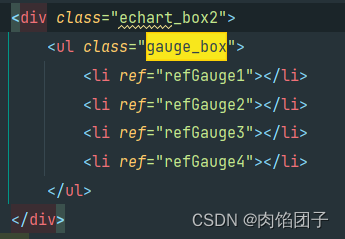
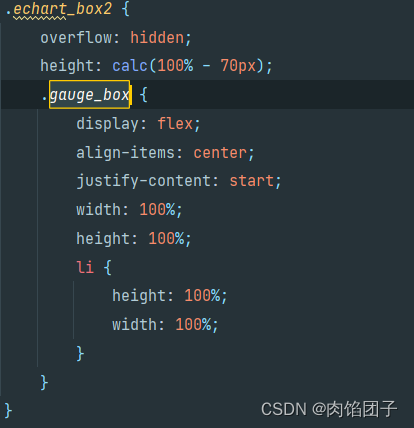
1.首先设置好盒子的宽高
demo页面

css页面

2. 该方法在进入页面时加载

3. methods方法:
// 待处理阈值实时监听handleRefGauge1() { const refGauge1 = this.$refs.refGauge1; this.initCharts(refGauge1, { //图表位置 grid: { top: '2%', left: '2%', right: '2%', bottom: '10%' }, title: [{ //标题 text: 'CPU利用率', left: 'center', top: '80%', textStyle: { //标题样式 color: '#fff', fontSize:12, fontWeight: 600, } }], series: [ { type: 'gauge', min: 0,//起始最小刻度值 max: 200,//最大刻度值 splitNumber: 10,//分隔份数 axisLine: { lineStyle: { width: 3, //仪表盘宽度 color: [ [0.2, '#228b22'], [0.8, '#0099ff'], [1, '#F1060B'] ], } }, radius: '85%',//仪表盘大小 markPoint: { // 仪表盘指针圆 animation: false, silent: true, data: [{ x: '50%', y: '50%', symbol: 'circle', symbolSize: 10, //指针中心圆大小 itemStyle: { color: '#0099ff' }, }], }, pointer: { // 仪表盘指针 //icon:'none', width:3,//指针的宽度 length:"60%", //指针长度,按照半圆半径的百分比 shadowColor : '#ccc', //默认透明 shadowBlur: 5 }, axisTick: { //刻度样式 distance: 0, //刻度线距仪表盘的距离 length: 5, //刻度线长度 lineStyle: { color: '#228b22', width: 1 //刻度线线宽 } }, //分隔线样式 splitLine: { distance: 0, //分隔线与轴线的距离 length: 3, lineStyle: { color: '#228b22', width: 1 } }, axisLabel: { //刻度标签 color: '#3488db', distance: 10, //标签与刻度线的距离 fontSize: 8 }, detail: { //仪表盘详情,用于显示数据 formatter: '{value}', color: '040755', fontSize: 12, //数据字体大小 top:'60%' }, data: [{ value: 60, top:'60%' //数据值位置 }] }, ] })},