一、运用Matlab对图像的基本处理
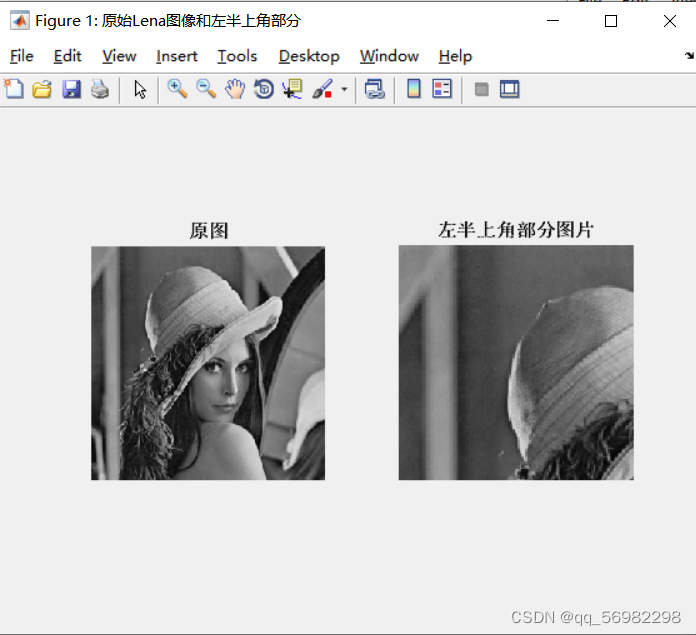
1、提取Lena图像的左半上角部分,与原始Lena图像在同一个figure中显示,并做适当命名
a =imread('Lena.bmp');%读取图片[m, n, c]=size(a);%取行数m和列数nhalf_x=floor(m/2);%floor是对m/2的结果取整,向下取整;ceil向上取整half_y=floor(n/2);img_b=a(1:half_x,1:half_y,:);%取左半上角figure;%figure创建图窗窗口subplot(1,2,1);%一个fugure图形生成一行两列两个子图,当前图像显示在第一个位置imshow(a);title('原始图像')%输出图像到板块上subplot(1,2,2);%第二个位置放更改后的图像imshow(img_b);title('左半上角') 效果图

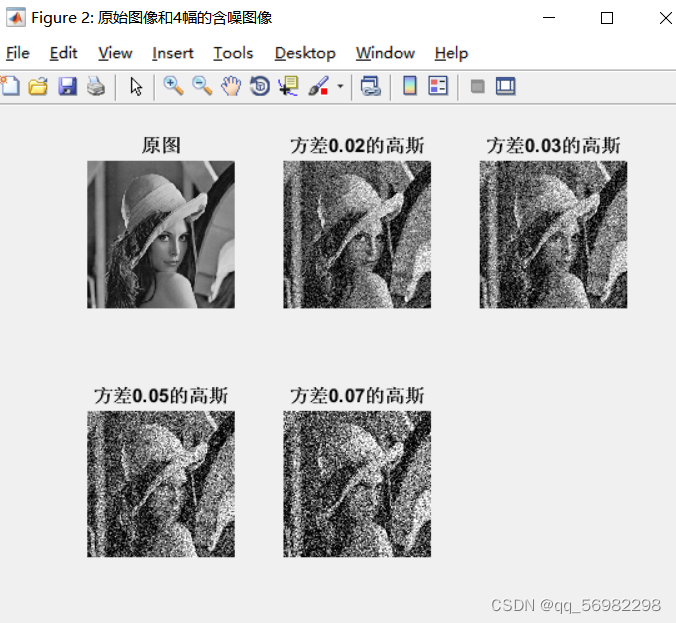
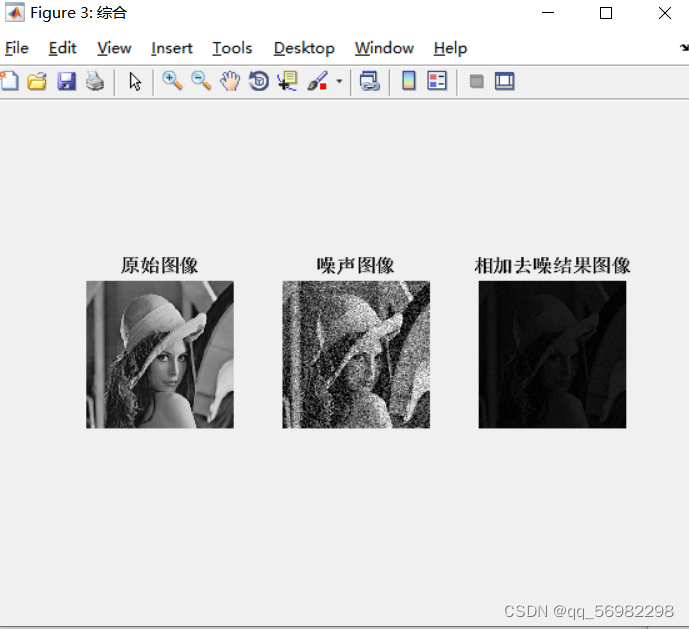
2、利用 imnoise , 对原始Lena图像叠加高斯噪声,产生4幅、14幅、140幅的含噪图像。对这些含噪图像采用 相加 运算,来验证、比较图像相加消除叠加性噪声的效果。将原始图像、1幅噪声图像、1幅相加去噪结果图像显示在一个figure 中
% 利用 imnoise , 对原始Lena图像叠加高斯噪声,产生4幅含噪图像% g=imnoise(图像名称,‘gaussian’,m,var) 均值m,方差为var的高斯噪声添加到原图像上,默认值均值是0,方差为0-1img1=imread('Lena.bmp'); %图形文件读取图像MATLAB空间 A = imread(filename)%高斯噪声,图像是img,均值为0,方差为nos1 = imnoise(img1,'gaussian',0,0.02);nos2=imnoise(img1,'gaussian',0,0.03);nos3=imnoise(img1,'gaussian',0,0.05);nos4=imnoise(img1,'gaussian',0,0.07);figure('Name','原始图像和4幅的含噪图像');subplot(2,3,1); imshow(img1); title('原图');%两行三列第一张图subplot(2,3,2); imshow(nos1); title('方差0.02的高斯');subplot(2,3,3); imshow(nos2); title('方差0.03的高斯');subplot(2,3,4); imshow(nos3); title('方差0.05的高斯');subplot(2,3,5); imshow(nos4); title('方差0.07的高斯'); %产生4幅、14幅、140幅的含噪图像。对这些含噪图像采用 相加 运算,来验证、比较图像相加消除叠加性噪声的效果。
img1=im2double(img1); %将img1数据类型转换成双精度% A=im2double(A);nos3=im2double(nos3); %14幅的含噪图像for i=1:14 %i从1到14,每次增加一个,该共循环14次,每写一层循环,必须以end结尾nos1 = imnoise(img1,'gaussian',0,0.02);A=imadd(nos1,img1);%对原始图像和含噪图像继续叠加% figure();imshow(nos1); %将14幅图像显示出来end% figure('Name','原始图像与nos1的叠加');imshow(A);avg_A=A/15;%求叠加后的平均图像%140幅的含噪图像for i=1:140 nos3 = imnoise(img1,'gaussian',0,0.05); B=imadd(nos3,img1);%对原始图像和含噪图像3叠加% figure();imshow(nos3); end% figure('Name','原始图像与nos3的叠加');imshow(B);figure('Name','综合');subplot(1,3,1);imshow(img1);title('原始图像');subplot(1,3,2);imshow(nos1);title('噪声图像');subplot(1,3,3);imshow(avg_A);title('相加去噪结果图像');

二、熟悉Matlab基本编程
1、利用 imresize , 采用nearest方法先将Lena缩小2倍后再分别采用nearest、bilinear、bicubic方法放大4倍,显示在不同的Figure中
I=imread('Lena.bmp');I_shrink_2_nearest=imresize(I,0.5,'nearest');%Lena缩小2倍figure; imshow(I); title('原图');
figure; imshow(I_shrink_2_nearest);title('nearest:缩小2倍的图') 
I_magnify_4_nearest=imresize(I_shrink_2_nearest,4,'nearest');%用nearest方法将I_shrink_2_nearest 放大4倍figure; imshow(I_magnify_4_nearest);title('nearest:放大4倍的图')

%用bilinear方法 将I_shrink_2_nearest 放大4倍I_magnify_4_bilinear=imresize(I_shrink_2_nearest,4,'bilinear');figure; imshow(I_magnify_4_bilinear);title('bilinear:放大4倍的图')
%用bicubic方法 将I_shrink_2_nearest 放大4倍的图I_magnify_4_bicubic=imresize(I_shrink_2_nearest,4,'bicubic');figure; imshow(I_magnify_4_bicubic);title('bicubic:放大4倍的图')
2、利用循环逐像素点计算原始Lena图像的均值和方差
img1=imread('Lena.bmp');
[r,c,k]=size(img1);%取图像的行数r和列数c
s=0;
for x=1:r %从1遍历到r行
for y=1:c %从1遍历到c列
s=s+img1(x,y);%求像素值总和 s , img1(x,y)表示位于某个坐标下的像素值
end
end
img1_mean = s/(r*c); %按公式计算,像素值总和除以像素个数。
Matlab_img1_mean1=mean2(img1); %Matlab方法一 : mean2()矩阵元素的平均值或均值
Matlab_img1_mean2=mean(mean(img1)); %Matlab方法二: 先计算列向量均值,再求总均值。
temp=0;
for i =1:r
for j =1:c
temp=temp+(img1(x,y)-img1_mean)^2; %求得所有像素与均值的平方和。
end
end
img1_var = temp/(r*c-1); %利用方差公式求得
% Matlab方法一: B = std2(A) 计算数组 A 中所有值的标准差。方差=标准差^2
Matlab_img1_std1=std2(img1)^2;
% Matlab_img1_std2=var(img1(:)); % Matlab方法二:利用方差函数var求得
4、不用 imresize , 利用循环将Lena图像以nearest方式缩小2倍放大2倍
img_11=imread('Lena.bmp');
[row,col]= size(img_11); %% 获得图像的行列数及色板数
p=0.5;
q=0.5;
m=round(p*row); % 新图像行
n=round(q*col); % 新图像列
for i=1:m
for j=1:n
x=round(i/p);
y=round(j/q);
new_img_11(i,j)=img_11(x,y,:);
end
end
b=uint8(new_img_11);
figure;
imshow(b);title('最邻近插值缩小2倍放大2倍')
%利用循环将任一灰度图像以nearest方式行缩放p倍,列缩放q倍
p=input('输入行缩放倍数(大于0的任意正实数):\n');
q=input('输入列缩放倍数(大于0的任意正实数):\n');
a=imread('Lena.bmp');
[m,n,c]=size(a);
new_m=ceil(p*m);%ceil函数向上取整
new_n=ceil(q*n);
new_a=zeros(new_m,new_n,c);%zeros函数是用于返回一个double类零矩阵
for i=1:new_m
for j=1:new_n
% 缩放后的图像坐标在原图像处的位置
x=round(i/p);
y=round(j/q);
if (x<1)
x=1;
end
if (x>m)
x=m;
end
if (y<1)
y=1;
end
if (y>n)
y=n;
end
% 将缩放后的图像坐标在原图像处的位置的灰度值赋值给缩放后的图像
new_a(i,j,:)=a(x,y,:);
end
end
new_a=uint8(new_a);
figure;
imshow(a);%显示坐标轴
axis on
title(['原图像(大小为:',num2str(m),'X',num2str(n),'X',num2str(c),')']);%转换成字符串表示形式
figure;imshow(new_a);
axis on
title(['缩放后的图像(大小为:',num2str(new_m),'X',num2str(new_n),'X',num2str(c),')']);
有不懂的函数可以在这里输入相应的函数,有解释的MathWorks - MATLAB 和 Simulink的制造者 - MATLAB & Simulink
有错误的话,欢迎纠错