目录
一、首先进行canny边缘检测,为获取车道线边缘做准备
二、进行ROI提取获取确切的车道线边缘(红色线内部)
三、利用概率霍夫变换获取直线,并将斜率正数和复数的线段给分割开来
四、离群值过滤,剔除斜率相差过大的线段
五、最小二乘拟合,实现将左边和右边的线段互相拟合成一条直线,形成车道线
六、绘制线段
全部代码(视频显示)
一、首先进行canny边缘检测,为获取车道线边缘做准备
import cv2gray_img = cv2.imread('img.jpg',cv2.IMREAD_GRAYSCALE)canny_img = cv2.Canny(gray_img,50,100)cv2.imwrite('canny_img.jpg',canny_img)cv2.imshow('canny',canny_img)cv2.waitKey(0)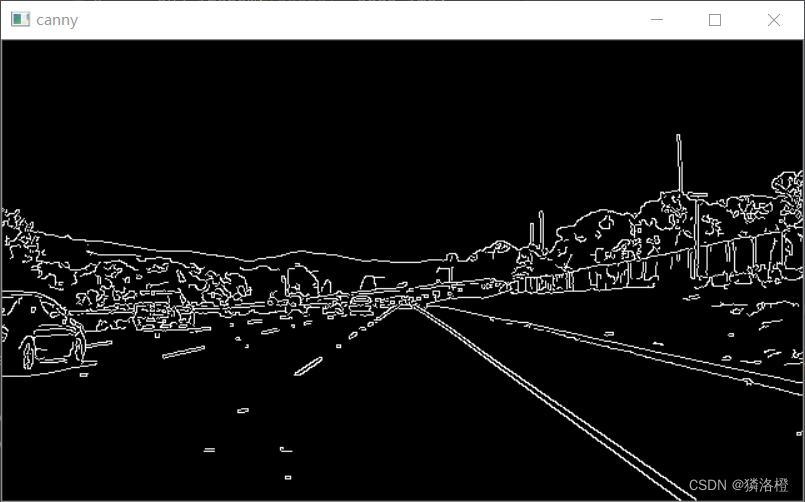
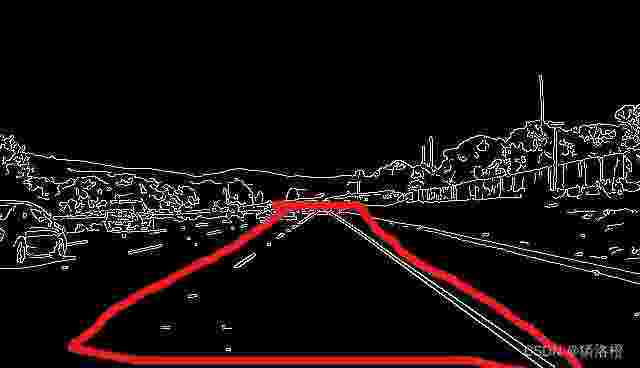
二、进行ROI提取获取确切的车道线边缘(红色线内部)
方法:在图像中,黑色表示0,白色为1,那么要保留矩形内的白色线,就使用逻辑与,当然前提是图像矩形外也是0,那么就采用创建一个全0图像,然后在矩形内全1,之后与之前的canny图像进行与操作,即可得到需要的车道线边缘。
import cv2import numpy as npcanny_img = cv2.imread('canny_img.jpg',cv2.IMREAD_GRAYSCALE)roi = np.zeros_like(canny_img)roi = cv2.fillPoly(roi,np.array([[[0, 368],[300, 210], [340, 210], [640, 368]]]),color=255)roi_img = cv2.bitwise_and(canny_img, roi)cv2.imwrite('roi_img.jpg',roi_img)cv2.imshow('roi_img',roi_img)cv2.waitKey(0)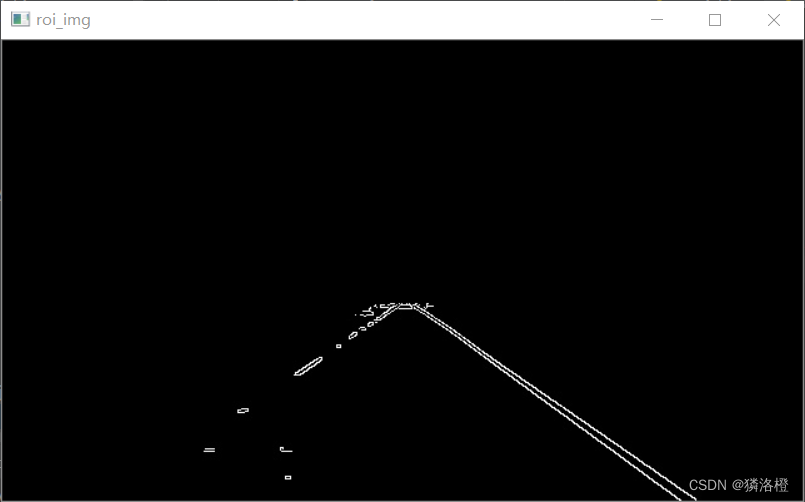
三、利用概率霍夫变换获取直线,并将斜率正数和复数的线段给分割开来
TIPs:使用霍夫变换需要将图像先二值化
概率霍夫变换函数:
lines=cv2.HoughLinesP(image, rho,theta,threshold,minLineLength, maxLineGap)image:图像,必须是8位单通道二值图像rho:以像素为单位的距离r的精度,一般情况下是使用1theta:表示搜索可能的角度,使用的精度是np.pi/180threshold:阈值,该值越小,判定的直线越多,相反则直线越少minLineLength:默认为0,控制接受直线的最小长度maxLineGap:控制接受共线线段的最小间隔,如果两点间隔超过了参数,就认为两点不在同一直线上,默认为0lines:返回值由numpy.ndarray构成,每一对都是一对浮点数,表示线段的两个端点import cv2import numpy as np#计算斜率def calculate_slope(line): x_1, y_1, x_2, y_2 = line[0] return (y_2 - y_1) / (x_2 - x_1)edge_img = cv2.imread('masked_edge_img.jpg', cv2.IMREAD_GRAYSCALE)#霍夫变换获取所有线段lines = cv2.HoughLinesP(edge_img, 1, np.pi / 180, 15, minLineLength=40, maxLineGap=20)#利用斜率划分线段left_lines = [line for line in lines if calculate_slope(line) < 0]right_lines = [line for line in lines if calculate_slope(line) > 0]四、离群值过滤,剔除斜率相差过大的线段
流程:
获取所有的线段的斜率,然后计算斜率的平均值遍历所有斜率,计算和平均斜率的差值,寻找最大的那个斜率对应的直线,如果差值大于阈值,那么就从列表中剔除对应的线段和斜率循环执行操作,直到剩下的全部都是小于阈值的线段def reject_abnormal_lines(lines, threshold): slopes = [calculate_slope(line) for line in lines] while len(lines) > 0: mean = np.mean(slopes) diff = [abs(s - mean) for s in slopes] idx = np.argmax(diff) if diff[idx] > threshold: slopes.pop(idx) lines.pop(idx) else: break return linesreject_abnormal_lines(left_lines, threshold=0.2)reject_abnormal_lines(right_lines, threshold=0.2)五、最小二乘拟合,实现将左边和右边的线段互相拟合成一条直线,形成车道线
流程:
取出所有的直线的x和y坐标,组成列表,利用np.ravel进行将高维转一维数组利用np.polyfit进行直线的拟合,最终得到拟合后的直线的斜率和截距,类似y=kx+b的(k,b)最终要返回(x_min,y_min,x_max,y_max)的一个np.array的数据,那么就是用np.polyval求多项式的值,举个example,np.polyval([3,0,1], 5) # 3 * 5**2 + 0 * 5**1 + 1,即可以获得对应x坐标的y坐标。def least_squares_fit(lines): # 1. 取出所有坐标点 x_coords = np.ravel([[line[0][0], line[0][2]] for line in lines]) y_coords = np.ravel([[line[0][1], line[0][3]] for line in lines]) # 2. 进行直线拟合.得到多项式系数 poly = np.polyfit(x_coords, y_coords, deg=1) print(poly) # 3. 根据多项式系数,计算两个直线上的点,用于唯一确定这条直线 point_min = (np.min(x_coords), np.polyval(poly, np.min(x_coords))) point_max = (np.max(x_coords), np.polyval(poly, np.max(x_coords))) return np.array([point_min, point_max], dtype=np.int)print("left lane")print(least_squares_fit(left_lines))print("right lane")print(least_squares_fit(right_lines))六、绘制线段
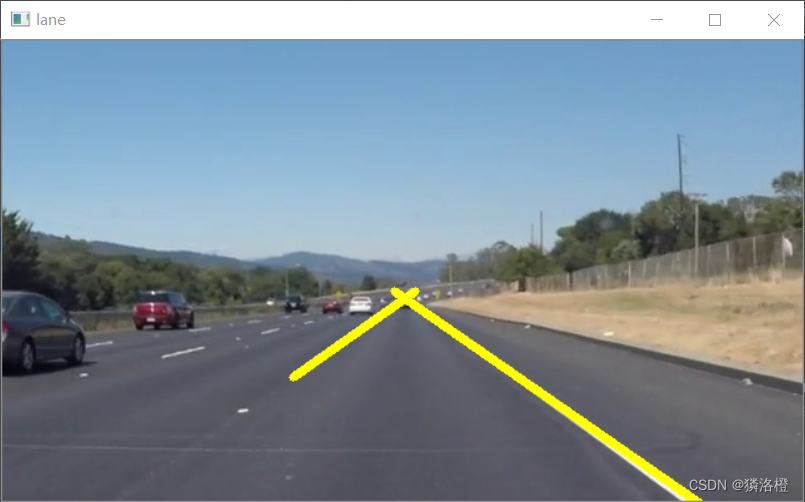
cv2.line(img, tuple(left_line[0]), tuple(left_line[1]), color=(0, 255, 255), thickness=5)cv2.line(img, tuple(right_line[0]), tuple(right_line[1]), color=(0, 255, 255), thickness=5)全部代码(视频显示)
import cv2import numpy as npdef get_edge_img(color_img, gaussian_ksize=5, gaussian_sigmax=1, canny_threshold1=50, canny_threshold2=100): """ 灰度化,模糊,canny变换,提取边缘 :param color_img: 彩色图,channels=3 """ gaussian = cv2.GaussianBlur(color_img, (gaussian_ksize, gaussian_ksize), gaussian_sigmax) gray_img = cv2.cvtColor(gaussian, cv2.COLOR_BGR2GRAY) edges_img = cv2.Canny(gray_img, canny_threshold1, canny_threshold2) return edges_imgdef roi_mask(gray_img): """ 对gray_img进行掩膜 :param gray_img: 灰度图,channels=1 """ poly_pts = np.array([[[0, 368], [300, 210], [340, 210], [640, 368]]]) mask = np.zeros_like(gray_img) mask = cv2.fillPoly(mask, pts=poly_pts, color=255) img_mask = cv2.bitwise_and(gray_img, mask) return img_maskdef get_lines(edge_img): """ 获取edge_img中的所有线段 :param edge_img: 标记边缘的灰度图 """ def calculate_slope(line): """ 计算线段line的斜率 :param line: np.array([[x_1, y_1, x_2, y_2]]) :return: """ x_1, y_1, x_2, y_2 = line[0] return (y_2 - y_1) / (x_2 - x_1) def reject_abnormal_lines(lines, threshold=0.2): """ 剔除斜率不一致的线段 :param lines: 线段集合, [np.array([[x_1, y_1, x_2, y_2]]),np.array([[x_1, y_1, x_2, y_2]]),...,np.array([[x_1, y_1, x_2, y_2]])] """ slopes = [calculate_slope(line) for line in lines] while len(lines) > 0: mean = np.mean(slopes) diff = [abs(s - mean) for s in slopes] idx = np.argmax(diff) if diff[idx] > threshold: slopes.pop(idx) lines.pop(idx) else: break return lines def least_squares_fit(lines): """ 将lines中的线段拟合成一条线段 :param lines: 线段集合, [np.array([[x_1, y_1, x_2, y_2]]),np.array([[x_1, y_1, x_2, y_2]]),...,np.array([[x_1, y_1, x_2, y_2]])] :return: 线段上的两点,np.array([[xmin, ymin], [xmax, ymax]]) """ x_coords = np.ravel([[line[0][0], line[0][2]] for line in lines]) y_coords = np.ravel([[line[0][1], line[0][3]] for line in lines]) poly = np.polyfit(x_coords, y_coords, deg=1) point_min = (np.min(x_coords), np.polyval(poly, np.min(x_coords))) point_max = (np.max(x_coords), np.polyval(poly, np.max(x_coords))) return np.array([point_min, point_max], dtype=np.int) # 获取所有线段 lines = cv2.HoughLinesP(edge_img, 1, np.pi / 180, 15, minLineLength=40, maxLineGap=20) # 按照斜率分成车道线 left_lines = [line for line in lines if calculate_slope(line) > 0] right_lines = [line for line in lines if calculate_slope(line) < 0] # 剔除离群线段 left_lines = reject_abnormal_lines(left_lines) right_lines = reject_abnormal_lines(right_lines) return least_squares_fit(left_lines), least_squares_fit(right_lines)def draw_lines(img, lines): left_line, right_line = lines cv2.line(img, tuple(left_line[0]), tuple(left_line[1]), color=(0, 255, 255), thickness=5) cv2.line(img, tuple(right_line[0]), tuple(right_line[1]), color=(0, 255, 255), thickness=5)def show_lane(color_img): edge_img = get_edge_img(color_img) mask_gray_img = roi_mask(edge_img) lines = get_lines(mask_gray_img) draw_lines(color_img, lines) return color_imgcapture = cv2.VideoCapture('video.mp4')while True: ret, frame = capture.read() if not ret: break frame = show_lane(frame) cv2.imshow('frame', frame) cv2.waitKey(10)