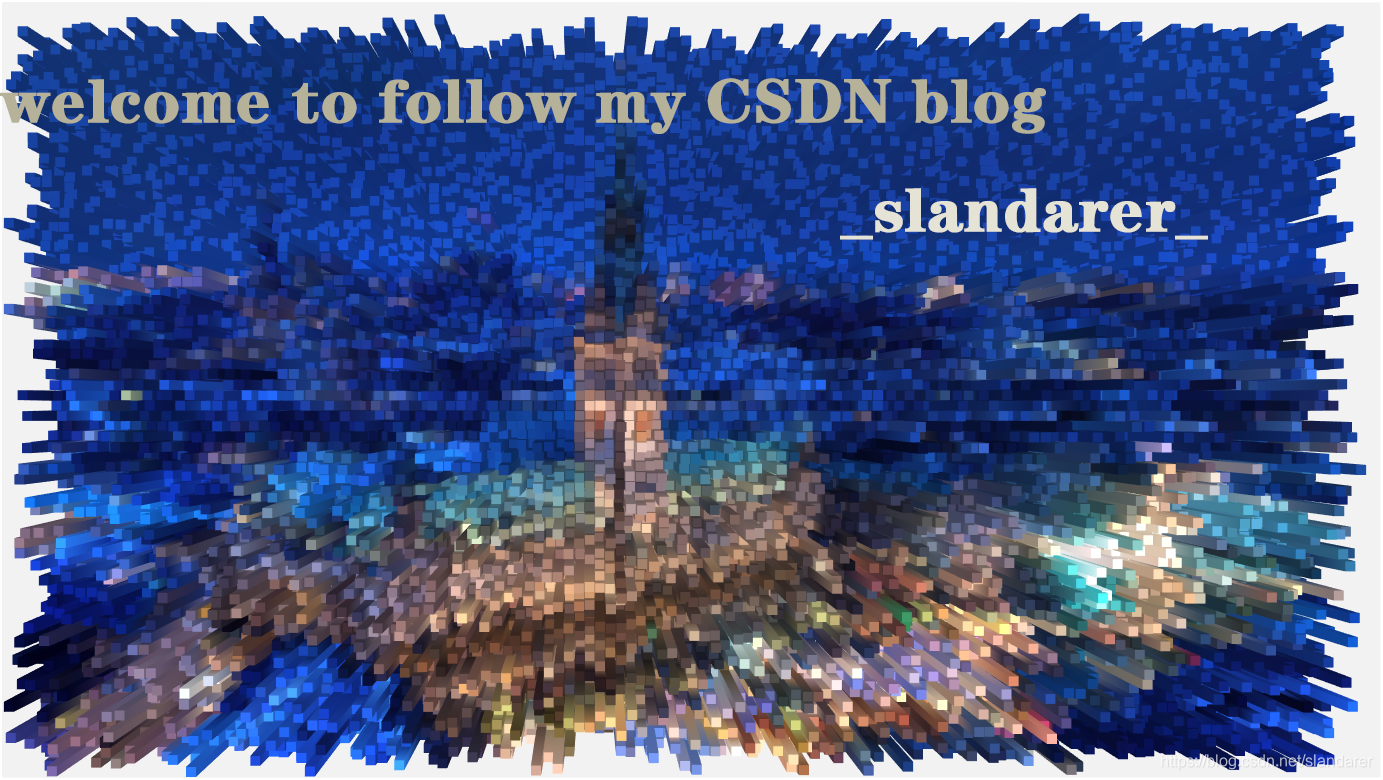
效果如下:
步骤
1.导入图片,获取每个区域的平均颜色,构造随机数矩阵
导入图片后我们首先将图片划分成很多个15x15(可自行调整大小)的小格子,并求取每个格子的颜色平均值,作为柱状图每个小柱子的颜色,构造随机数矩阵作为每个小柱子的高度
oriPic=imread('test.jpg');
pixLen=15;
[H,W,~]=size(oriPic);


XList=1:pixLen:W-pixLen;
YList=1:pixLen:H-pixLen;
samplePic=zeros(length(YList),length(XList),3);
for x=XList
    for y=YList
        sampleSquareR=double(oriPic(y:y-1+pixLen,x:x-1+pixLen,1));
        sampleSquareG=double(oriPic(y:y-1+pixLen,x:x-1+pixLen,2));
        sampleSquareB=double(oriPic(y:y-1+pixLen,x:x-1+pixLen,3));
        samplePic(y==YList,x==XList,1)=mean(sampleSquareR(:));
        samplePic(y==YList,x==XList,2)=mean(sampleSquareG(:));
        samplePic(y==YList,x==XList,3)=mean(sampleSquareB(:));
    end
end
randiMat=randi([0,250],[length(YList),length(XList)]);
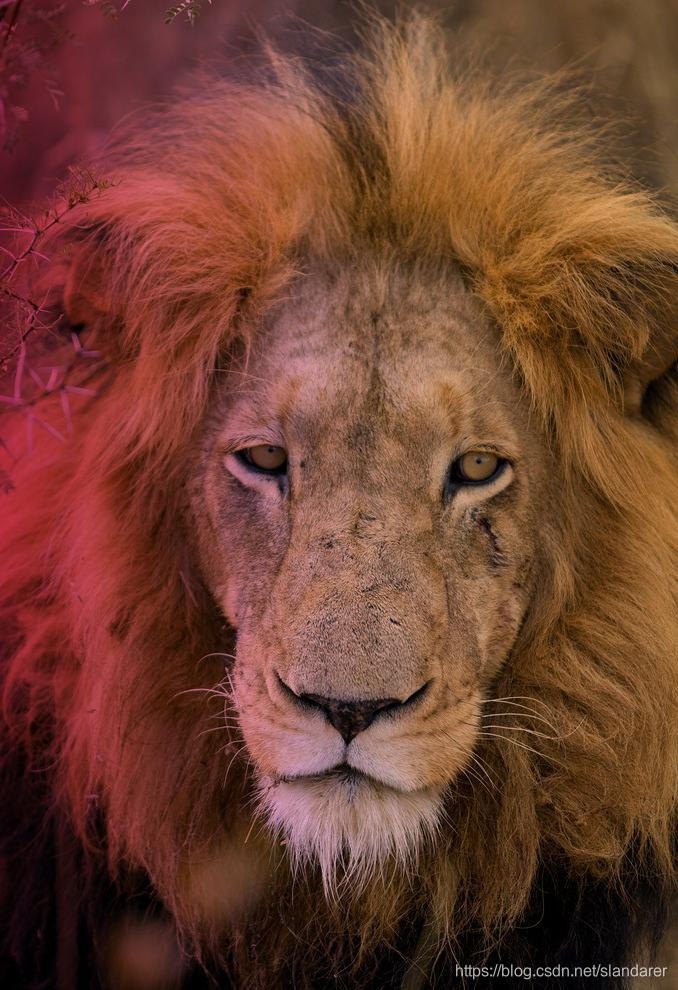
原始图片:
如果用方块颜色矩阵和方块高度矩阵直接去画图的话,会因为每个颜色只有一个点,而出现如下的效果,
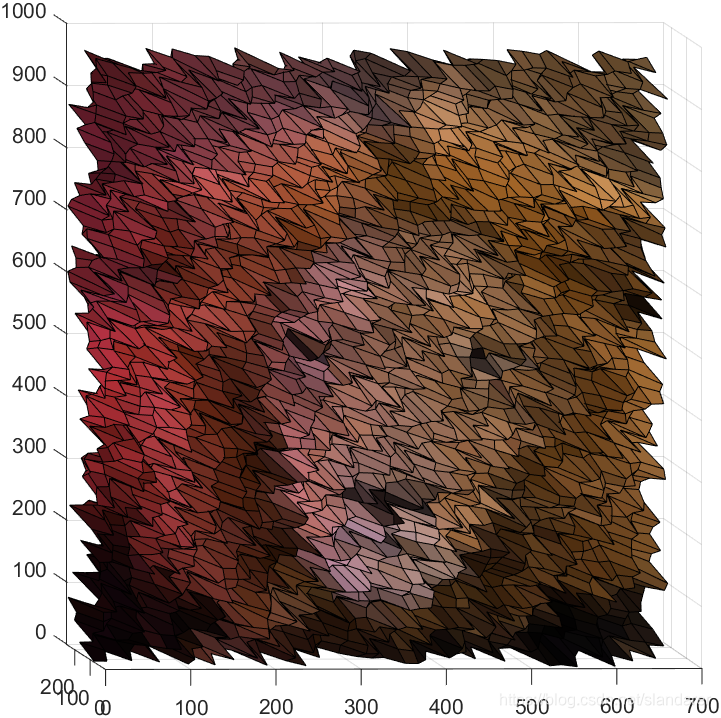
为了画出一个一个小平台的效果,我们要将每个点扩充成15X15个颜色相同,高度相同的点集
2.点集扩充,曲面绘制
expCMat=zeros(length(YList)*pixLen,length(XList)*pixLen,3);
expZMat=zeros(length(YList)*pixLen,length(XList)*pixLen);
for x=XList
    for y=YList
        expCMat(y:y-1+pixLen,x:x-1+pixLen,1)=samplePic(y==YList,x==XList,1);
        expCMat(y:y-1+pixLen,x:x-1+pixLen,2)=samplePic(y==YList,x==XList,2);
        expCMat(y:y-1+pixLen,x:x-1+pixLen,3)=samplePic(y==YList,x==XList,3);
        expZMat(y:y-1+pixLen,x:x-1+pixLen)=randiMat(y==YList,x==XList);
    end
end
[XMesh,YMesh]=meshgrid(1:length(XList)*pixLen,1:length(YList)*pixLen);
surf(XMesh,expZMat,YMesh(end:-1:1,:),'CData',expCMat./255,...
    'FaceColor','interp','edgeColor','none',...
    'SpecularStrength',0,'AmbientStrength',1,'DiffuseStrength',1)
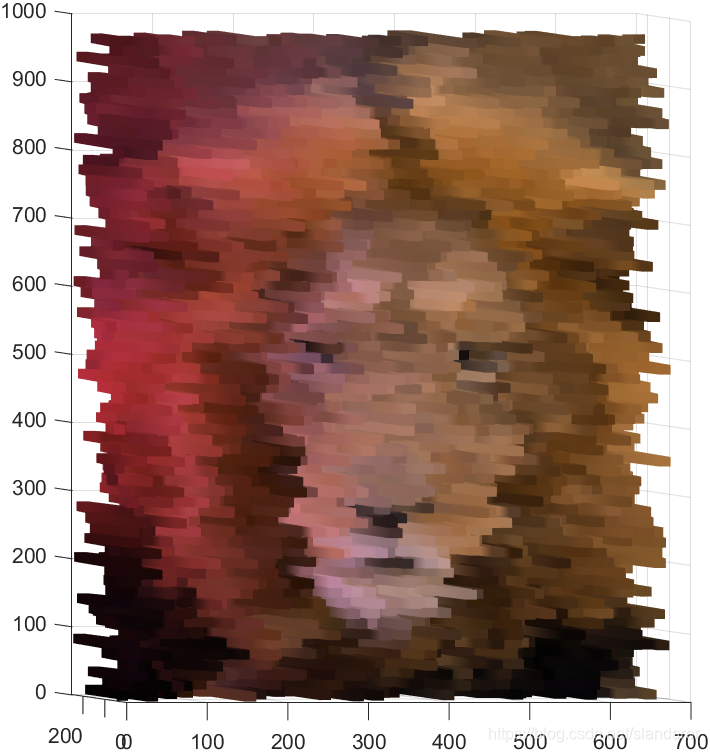
效果:
我们会发现此时每个小方块界限并不明显,而且当正面看时,曲面几乎看不出任何突出效果,这两点可以通过设置前缩透视法,和增添光照来解决

3.坐标区属性设置及前缩透视法
以下大部分代码为了调整视角和颜色,ax.Projection=‘perspective’; 用来设置前缩透视
ax=gca;
hold(ax,'on')
ax.Projection='perspective';
ax.Color=[0.95 0.95 0.95];
ax.DataAspectRatioMode='manual';
ax.DataAspectRatio=[1,0.1,1];
ax.XLim=[0,W];
ax.ZLim=[0,H];
ax.View=[-0.4830   -0.0717];
ax.XTick=[];
ax.YTick=[];
ax.ZTick=[];
ax.XColor='none';
ax.YColor='none';
ax.ZColor='none';
效果:

4.光照设置
可以根据自己的喜好微调哦
h = light;
h.Style='local';
h.Color=[1,1,1].*0.5;
h.Position=[W/2,-1000,0];
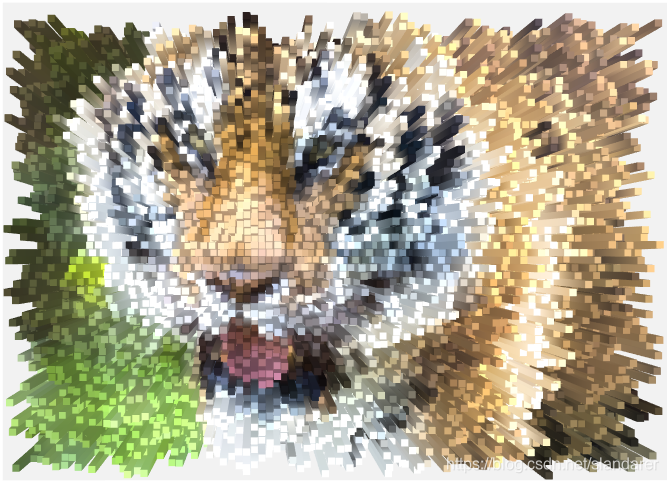
效果:
5.完整代码
function pieceWisePic

oriPic=imread('test4.jpg');
pixLen=15;
[H,W,~]=size(oriPic);


XList=1:pixLen:W-pixLen;
YList=1:pixLen:H-pixLen;
samplePic=zeros(length(YList),length(XList),3);
for x=XList
    for y=YList
        sampleSquareR=double(oriPic(y:y-1+pixLen,x:x-1+pixLen,1));
        sampleSquareG=double(oriPic(y:y-1+pixLen,x:x-1+pixLen,2));
        sampleSquareB=double(oriPic(y:y-1+pixLen,x:x-1+pixLen,3));
        samplePic(y==YList,x==XList,1)=mean(sampleSquareR(:));
        samplePic(y==YList,x==XList,2)=mean(sampleSquareG(:));
        samplePic(y==YList,x==XList,3)=mean(sampleSquareB(:));
    end
end
randiMat=randi([0,250],[length(YList),length(XList)]);

expCMat=zeros(length(YList)*pixLen,length(XList)*pixLen,3);
expZMat=zeros(length(YList)*pixLen,length(XList)*pixLen);
for x=XList
    for y=YList
        expCMat(y:y-1+pixLen,x:x-1+pixLen,1)=samplePic(y==YList,x==XList,1);
        expCMat(y:y-1+pixLen,x:x-1+pixLen,2)=samplePic(y==YList,x==XList,2);
        expCMat(y:y-1+pixLen,x:x-1+pixLen,3)=samplePic(y==YList,x==XList,3);
        expZMat(y:y-1+pixLen,x:x-1+pixLen)=randiMat(y==YList,x==XList);
    end
end
[XMesh,YMesh]=meshgrid(1:length(XList)*pixLen,1:length(YList)*pixLen);
surf(XMesh,expZMat,YMesh(end:-1:1,:),'CData',expCMat./255,...
    'FaceColor','interp','edgeColor','none',...
    'SpecularStrength',0,'AmbientStrength',1,'DiffuseStrength',1)


ax=gca;
hold(ax,'on')
ax.Projection='perspective';
ax.Color=[0.95 0.95 0.95];
ax.DataAspectRatioMode='manual';
ax.DataAspectRatio=[1,0.1,1];
ax.XLim=[0,W];
ax.ZLim=[0,H];
ax.View=[-0.4830   -0.0717];
ax.XTick=[];
ax.YTick=[];
ax.ZTick=[];
ax.XColor='none';
ax.YColor='none';
ax.ZColor='none';

h = light;
h.Style='local';
h.Color=[1,1,1].*0.5;
h.Position=[W/2,-1000,0];

end
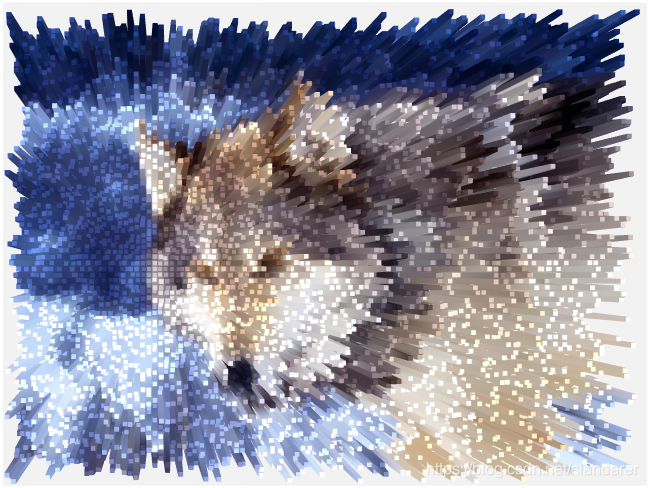
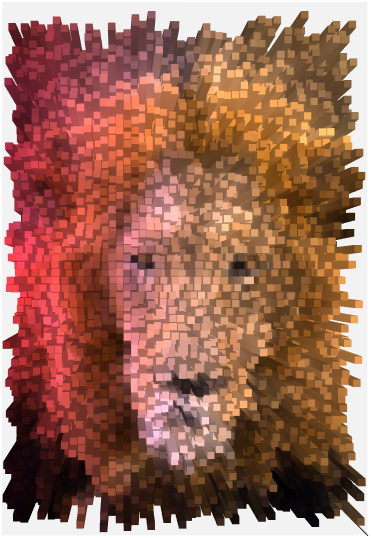
尝试的其他几个图
当方块取的较小时(5x5)
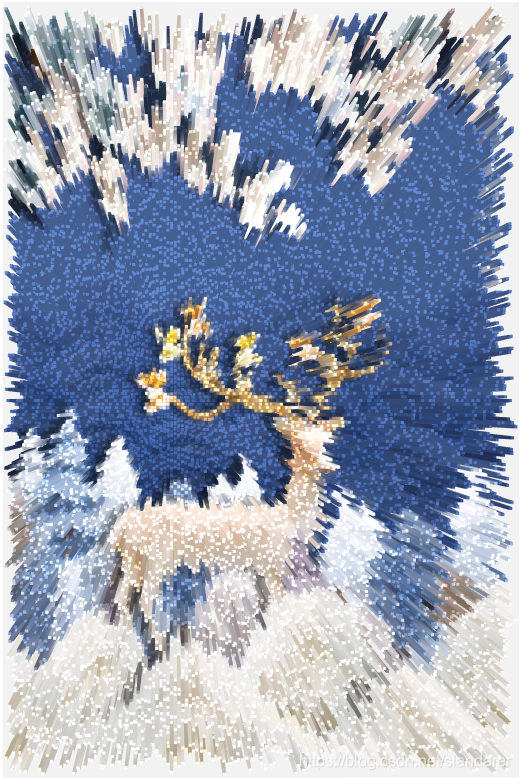
另:
