引言
在数据分析和机器学习领域,选择合适的模型对数据进行拟合是至关重要的。本文将通过一个实际的Python编程案例,比较线性、多项式、指数和高斯模型在数据拟合方面的性能。通过生成模拟数据,我们将使用这些模型进行拟合,并评估它们的均方误差(MSE)和决定系数(R^2),最后通过可视化直观地展示拟合效果。

方法
首先,我们使用numpy库生成了120个月的数据,并对这些数据应用了一个包含线性和二次项的函数,同时添加了正态分布的噪声。接着,我们定义了四种不同的模型:线性模型、三阶多项式模型、指数模型和高斯模型。
线性模型和三阶多项式模型使用sklearn的LinearRegression进行拟合。指数模型和高斯模型则通过scipy的curve_fit函数进行非线性最小二乘拟合。实验结果


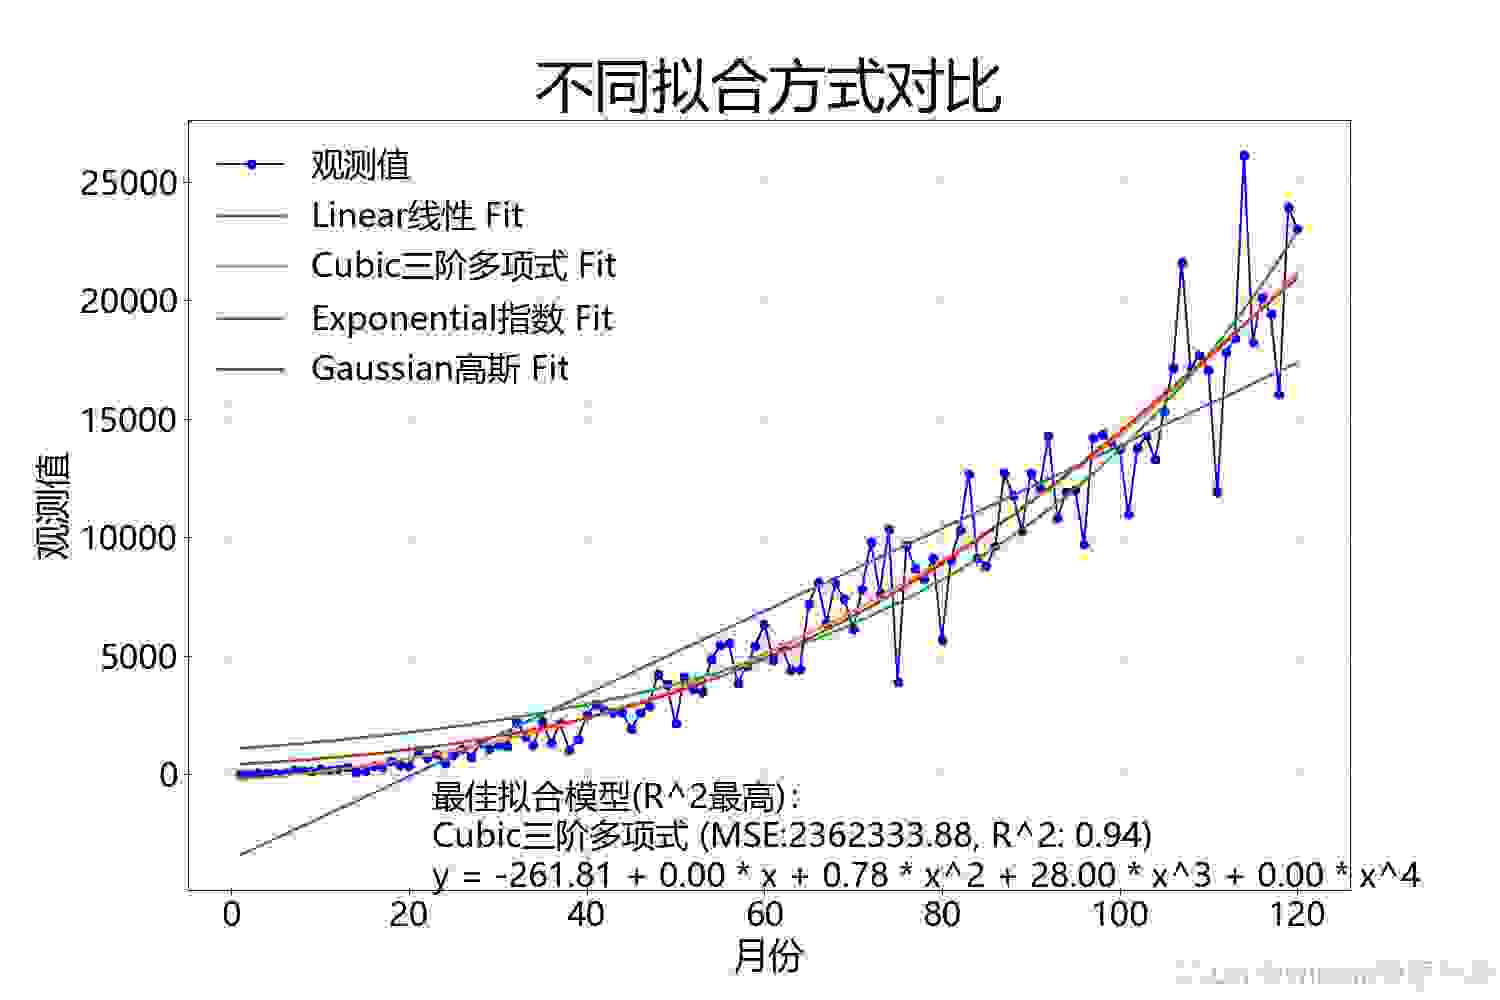
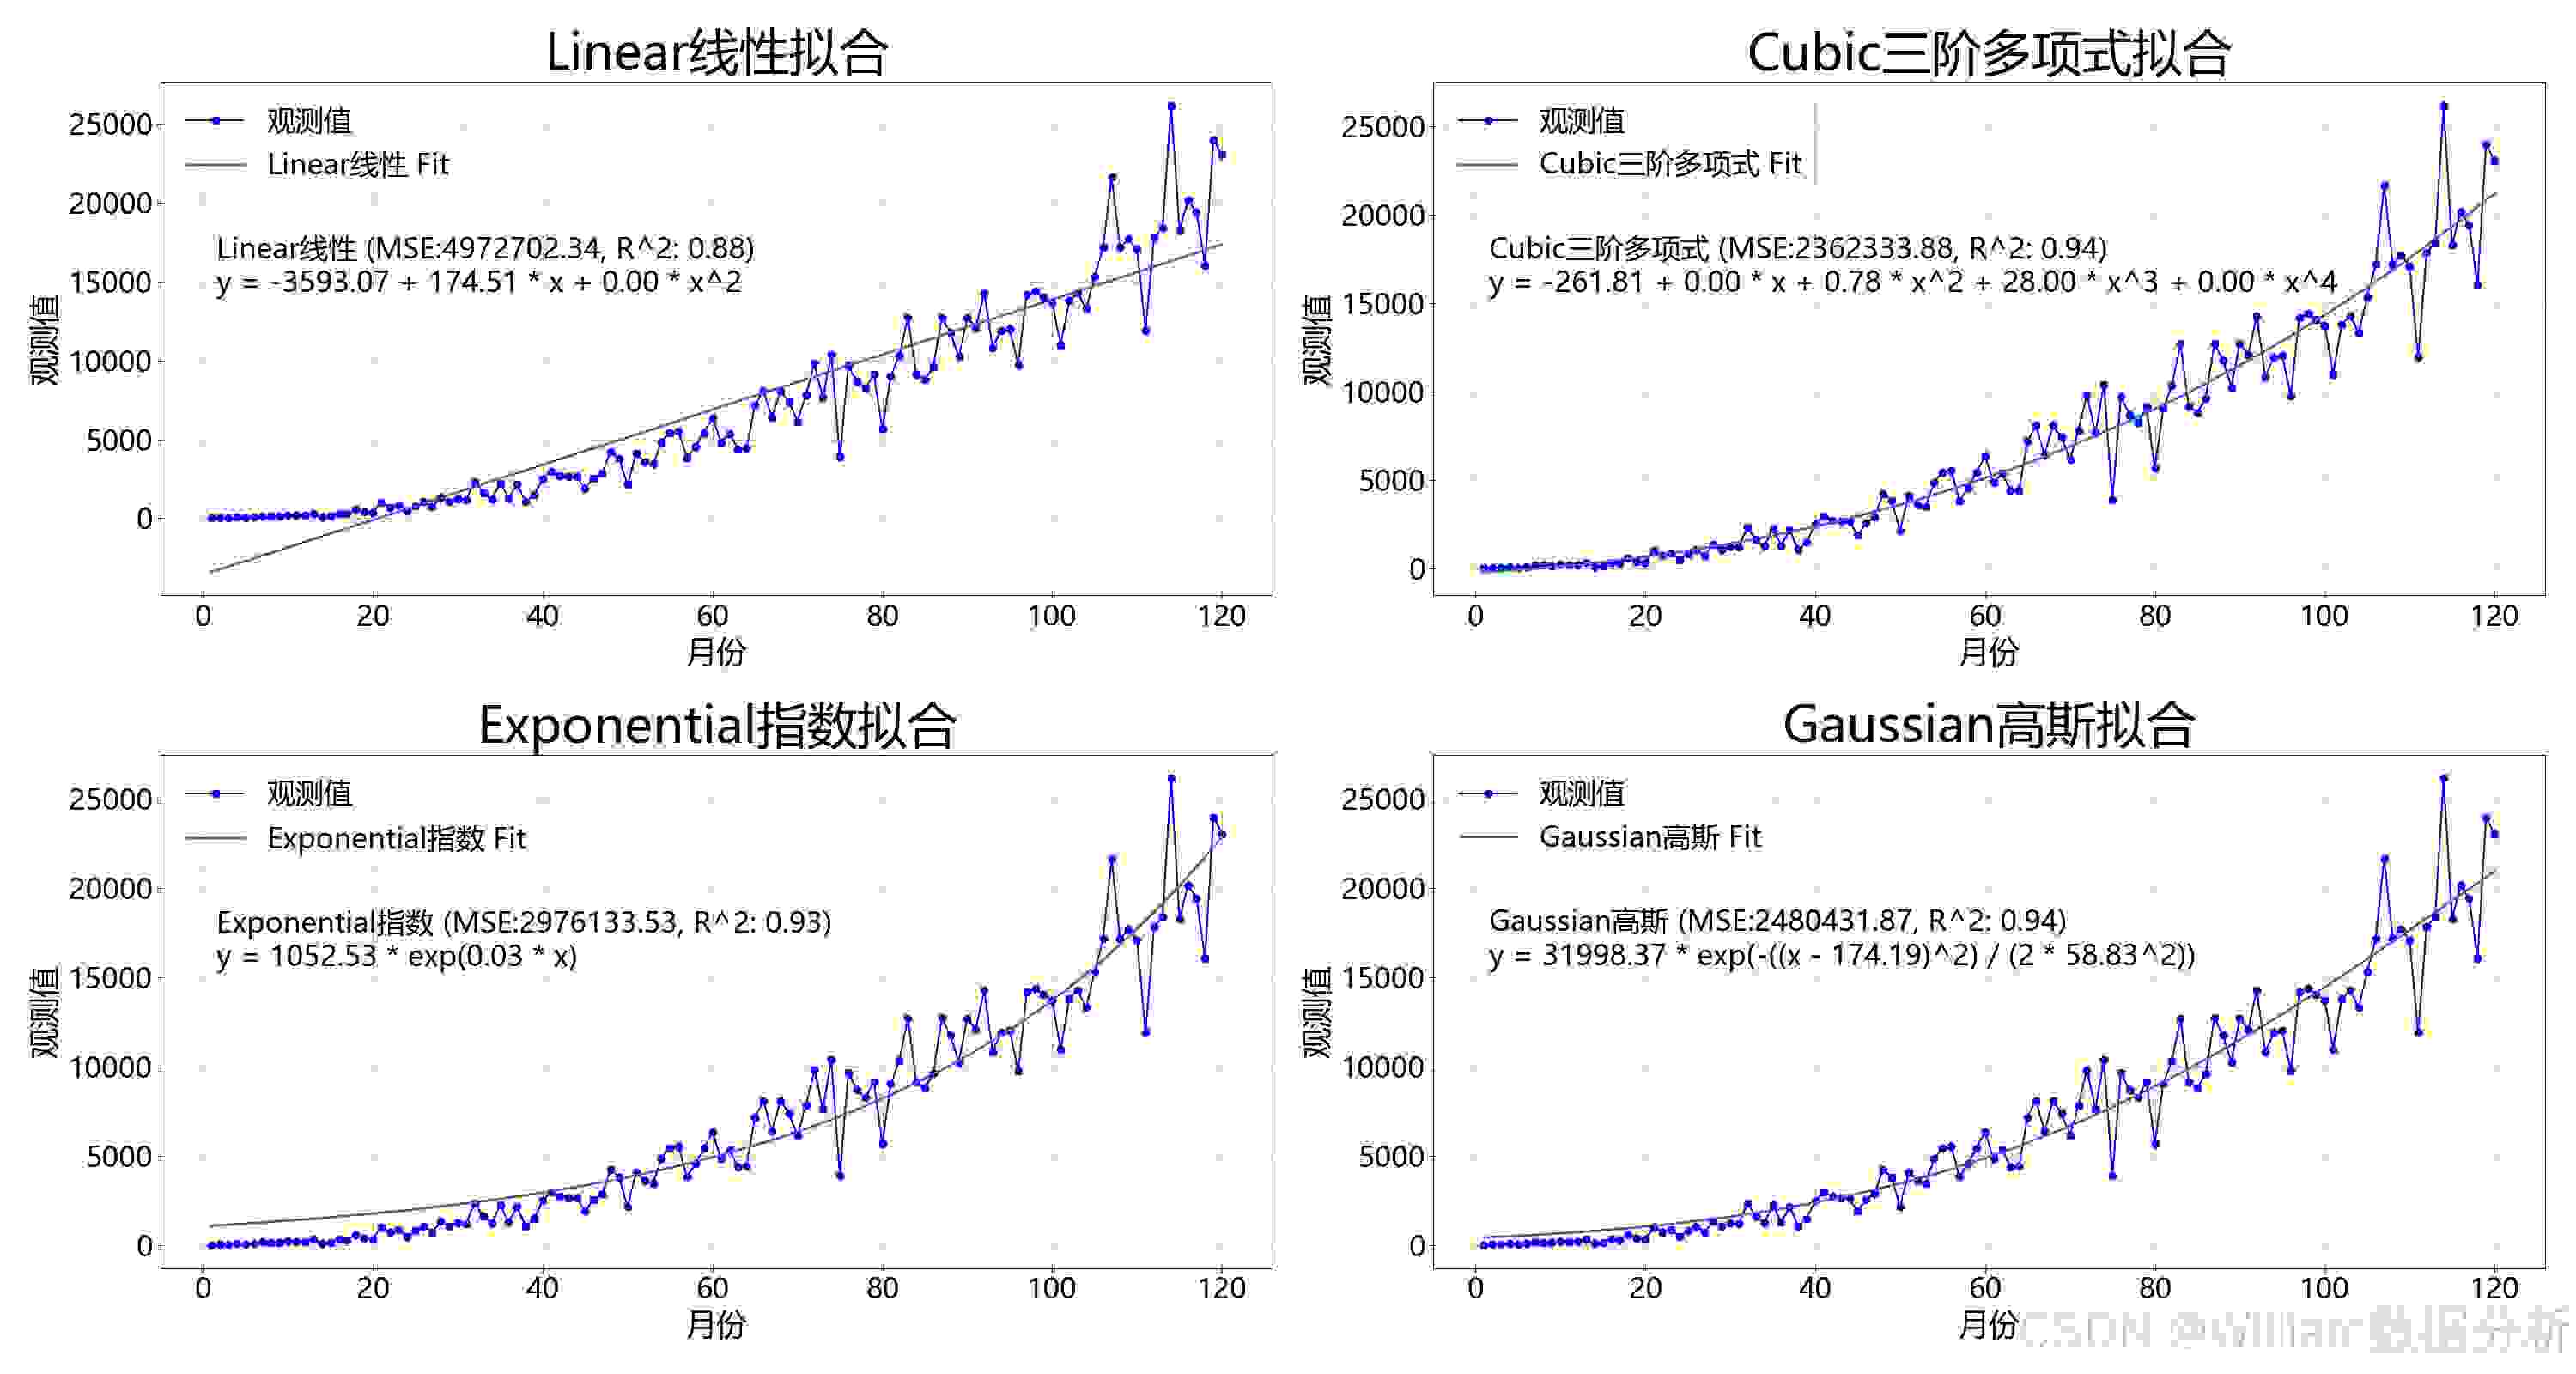
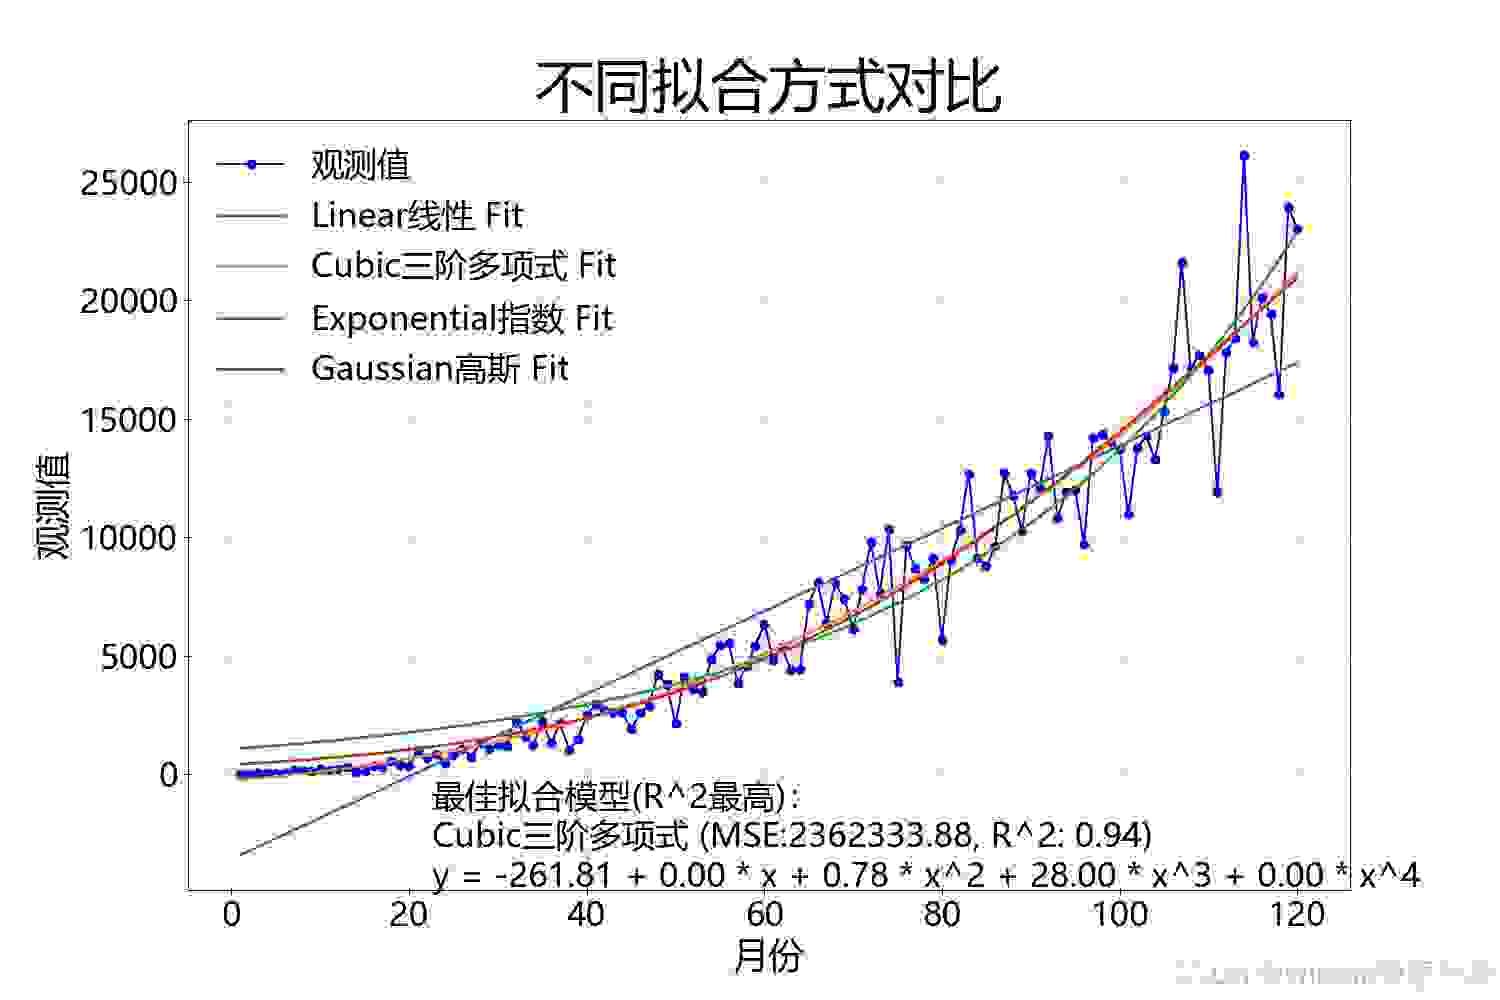
对于每种模型,我们计算了MSE和R^2值来评估拟合的好坏。MSE越低,R^2越接近1,表示模型拟合效果越好。实验结果显示,三阶多项式模型在本案例中表现最佳,其R^2值最高,MSE值最低。
可视化分析
我们使用matplotlib库对所有模型的拟合结果进行了可视化。每个模型的拟合曲线与原始数据一起展示在子图中,直观地比较了不同模型的拟合效果。此外,我们还展示了一个汇总图表,其中包括所有模型的拟合曲线,以及最佳拟合模型的详细信息。
结论
通过本次实验,我们可以看到不同模型在特定数据集上的拟合效果可以有显著差异。选择合适的模型对于数据分析和预测至关重要。此外,可视化是理解数据和模型性能的有力工具。
代码实现:
import numpy as npimport matplotlib.pyplot as pltfrom sklearn.preprocessing import PolynomialFeaturesfrom sklearn.linear_model import LinearRegressionfrom sklearn.metrics import mean_squared_error, r2_scorefrom scipy.optimize import curve_fit# 生成随机模拟数据np.random.seed(42)months = np.arange(1, 121)y = 3 * months + 1.4 * months**2 + np.random.normal(loc=0, scale=2*months**1.55, size=120) # 使用线性关系并添加噪声# 定义模型models = { "Linear线性": LinearRegression(), # "Quadratic二阶多项式": LinearRegression(), "Cubic三阶多项式": LinearRegression()}degrees = [1, 3]# 重新拟合模型predictions = {}mse_scores = {}r2_scores = {}fit_expressions = {}# 遍历每种模型for degree, model_name in zip(degrees, models.keys()): poly = PolynomialFeatures(degree=degree) X_poly = poly.fit_transform(months.reshape(-1, 1)) # 拟合模型 models[model_name].fit(X_poly, y) # 进行预测 y_pred = models[model_name].predict(X_poly) predictions[model_name] = y_pred mse_scores[model_name] = mean_squared_error(y, y_pred) r2_scores[model_name] = r2_score(y, y_pred) # 提取拟合表达式 coefficients = models[model_name].coef_ intercept = models[model_name].intercept_ fit_expression = f"y = {intercept:.2f}" for i, coef in enumerate(coefficients[::-1]): fit_expression += f" + {coef:.2f} * x{'^' + str(i+1) if i > 0 else ''}" fit_expressions[model_name] = fit_expression# 重新拟合指数模型def exponential_func(x, a, b): return a * np.exp(b * x)params_exp, _ = curve_fit(exponential_func, months, y, p0=(1, 0.01))y_exp_pred = exponential_func(months, *params_exp)predictions["Exponential指数"] = y_exp_predmse_scores["Exponential指数"] = mean_squared_error(y, y_exp_pred)r2_scores["Exponential指数"] = r2_score(y, y_exp_pred)fit_expressions["Exponential指数"] = f"y = {params_exp[0]:.2f} * exp({params_exp[1]:.2f} * x)"# 重新拟合高斯模型def gaussian_func(x, a, mu, sigma): return a * np.exp(-((x - mu)**2) / (2 * sigma**2))try: params_gauss, _ = curve_fit(gaussian_func, months, y, p0=(max(y), np.mean(months), 10), maxfev=10000, bounds=(0, [np.inf, np.inf, np.inf])) y_gauss_pred = gaussian_func(months, *params_gauss) predictions["Gaussian高斯"] = y_gauss_pred mse_scores["Gaussian高斯"] = mean_squared_error(y, y_gauss_pred) r2_scores["Gaussian高斯"] = r2_score(y, y_gauss_pred) fit_expressions["Gaussian高斯"] = f"y = {params_gauss[0]:.2f} * exp(-((x - {params_gauss[1]:.2f})^2) / (2 * {params_gauss[2]:.2f}^2))"except RuntimeError as e: print("Gaussian fitting failed:", e)# 可视化结果,设置字体为微软雅黑plt.rcParams['font.sans-serif'] = ['Microsoft YaHei']plt.rcParams['axes.unicode_minus'] = Falseplt.rcParams.update({'font.size': 24}) # 设置全局字体大小# 创建一个图表和子图布局fig, axs = plt.subplots(2, 2, figsize=(30, 16))# 用于存储所有模型名称的列表all_model_names = list(predictions.keys())# 遍历每个子图和模型for ax, model_name in zip(axs.flatten(), all_model_names): ax.plot(months, y, color='blue', label='观测值', marker='o', linestyle='-') ax.plot(months, predictions[model_name], label=f'{model_name} Fit', linewidth=2) ax.set_title(f'{model_name}拟合', fontsize=42) ax.set_xlabel('月份', fontsize=26) ax.set_ylabel('观测值', fontsize=26) ax.legend() ax.grid() # 在子图上添加文本框以显示模型的信息 ax.text(0.05, .7, f"{model_name} (MSE:{mse_scores[model_name]:.2f}, R^2: {r2_scores[model_name]:.2f})\n{fit_expressions[model_name]}", transform=ax.transAxes, verticalalignment='top', horizontalalignment='left', color='black')plt.subplots_adjust(left=0.1, right=0.9, bottom=0.1, top=0.9, wspace=0.2, hspace=0.4)plt.tight_layout()plt.savefig('拟合对比-分开.jpg')plt.show()# 获取最佳拟合best_model_name = max(r2_scores, key=r2_scores.get) # 获取R^2分数最高的模型名称# 创建一个新图来显示所有模型的拟合结果plt.figure(figsize=(15, 10))plt.plot(months, y, color='blue', label='观测值', marker='o', linestyle='-')for model_name in all_model_names: plt.plot(months, predictions[model_name], label=f'{model_name} Fit', linewidth=2)plt.title('不同拟合方式对比', fontsize=42)plt.xlabel('月份', fontsize=26)plt.ylabel('观测值', fontsize=26)plt.legend()plt.grid()# 在图表上添加文本框以显示最佳拟合模型的信息plt.text(0.21, 0.14, f"最佳拟合模型(R^2最高):\n{best_model_name} (MSE:{mse_scores[best_model_name]:.2f}, R^2: {r2_scores[best_model_name]:.2f})\n{fit_expressions[best_model_name]}", transform=plt.gca().transAxes, verticalalignment='top', horizontalalignment='left', color='black')# 通过print输出其他模型的信息text_str = "五种拟合对比:\n"for idx, model_name in enumerate(all_model_names): text_str += f"{idx+1}.{model_name} (MSE:{mse_scores[model_name]:.2f}, R^2: {r2_scores[model_name]:.2f}):\n {fit_expressions[model_name]}\n"print(text_str)plt.savefig('拟合对比.jpg')plt.show()