引言
结合前面所学
http://ELK日志分析系统
一、为什么要做日志分析平台
随着业务量的增长,每天业务服务器将会产生上亿条的日志,单个日志文件达几个GB,这时我们发现用Linux自带工具,cat grep awk 分析越来越力不从心了,而且除了服务器日志,还有程序报错日志,分布在不同的服务器,查阅繁琐。
待解决的痛点:
大量不同种类的日志成为了运维人员的负担,不方便管理;单个日志文件巨大,无法使用常用的文本工具分析,检索困难;日志分布在多台不同的服务器上,业务一旦出现故障,需要一台台查看日志。二、ELK+Filebeat+Zookeeper+Kafka架构
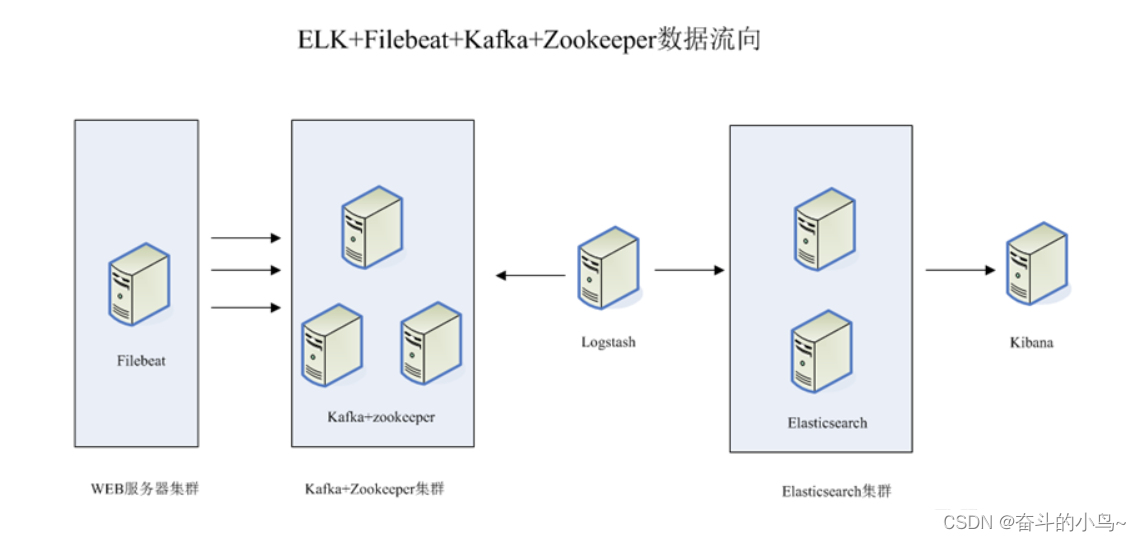
整体的架构如上图所示
这个架构图从左到右,总共分为5层,每层实现的功能和含义分别介绍如下:
第一层、数据采集层
数据采集层位于最左边的业务服务器集群上,在每个业务服务器上面安装了filebeat做日志收集,然后把采集到的原始日志发送到Kafka+zookeeper集群上。第二层、消息队列层
原始日志发送到Kafka+zookeeper集群上后,会进行集中存储,此时,filbeat是消息的生产者,存储的消息可以随时被消费。第三层、数据分析层
Logstash作为消费者,会去Kafka+zookeeper集群节点实时拉取原始日志,然后将获取到的原始日志根据规则进行分析、清洗、过滤,最后将清洗好的日志转发至Elasticsearch集群。第四层、数据持久化存储
Elasticsearch集群在接收到logstash发送过来的数据后,执行写磁盘,建索引库等操作,最后将结构化的数据存储到Elasticsearch集群上。第五层、数据查询、展示层
Kibana是一个可视化的数据展示平台,当有数据检索请求时,它从Elasticsearch集群上读取数据,然后进行可视化出图和多维度分析。三、搭建ELK+Filebeat+Zookeeper+Kafka
1、环境准备
| 服务器ip地址 | 节点名称 | 安装组件 |
|---|---|---|
| 192.168.10.100 | node1 | Elasticsearch 、Kibana |
| 192.168.10.101 | node2 | Elasticsearch |
| 192.168.10.102 | logstash | logstash、Apache |
| 192.168.10.103 | filebeat | filebeat |
| 192.168.10.104 | zk+kfk1 | zookeeper、Kafka |
| 192.168.10.105 | zk+kfk2 | zookeeper、Kafka |
所有服务器关闭防火墙以及核心防护
systemctl stop firewalldsetenforce 0修改主机名
##第一台[root@localhost ~]#hostnamectl set-hostname node1[root@localhost ~]#bash##第二台[root@localhost ~]#hostnamectl set-hostname node2[root@localhost ~]#bash##第三台[root@localhost ~]#hostnamectl set-hostname logstash[root@localhost ~]#bash##第四台[root@localhost ~]#hostnamectl set-hostname filebeat[root@localhost ~]#bash##第五台[root@localhost ~]#hostnamectl set-hostname zk-kfk1[root@localhost ~]#bash##第六台[root@localhost ~]#hostnamectl set-hostname zk-kfk2[root@localhost ~]#bash配置域名解析
echo "192.168.10.100 node1" > /etc/hostsecho "192.168.10.101 node2" > /etc/hostsecho "192.168.10.102 logstash" > /etc/hostsecho "192.168.10.103 filebeat" > /etc/hostsecho "192.168.10.104 zk-kfk1" > /etc/hostsecho "192.168.10.105 zk-kfk2" > /etc/hosts查看java环境
##java -versionopenjdk version "1.8.0_131"OpenJDK Runtime Environment (build 1.8.0_131-b12)OpenJDK 64-Bit Server VM (build 25.131-b12, mixed mode)2、部署ElasticSearch(在node1、node2节点上)
两台同时操作
1.安装ElasticSearch的rpm包,并解压
#上传elasticsearch-5.5.0.rpm到/opt目录下cd /optrz -Erpm -ivh elasticsearch-5.5.0.rpm ##解压2.加载服务系统并开启开机自启
systemctl daemon-reload ##加载服务systemctl enable elasticsearch.service ##设置开机自启服务3.修改ElasticSearch主配置文件
[root@node1 opt]#cp /etc/elasticsearch/elasticsearch.yml /etc/elasticsearch/elasticsearch.yml.bak ##先进性备份[root@node1 opt]#vim /etc/elasticsearch/elasticsearch.yml ###修改elasticsearch主配置文件 cluster.name: my-elk-cluster ##第17行, 取消注释,指定集群名字node.name: node1 ##第23行, 取消注释,指定节点名字:Node1节点为node1,Node2节点为node2path.data: /data/elk_data ##第33行, 取消注释,指定数据存放路径path.logs: /var/log/elasticsearch/ ##第37行, 取消注释,指定日志存放路径bootstrap.memory_lock: false ##第43行, 取消注释,改为在启动的时候不锁定内存network.host: 0.0.0.0 ##第55行, 取消注释,设置监听地址,0.0.0.0代表所有地址http.port: 9200 ##第59行, 取消注释,ES 服务的默认监听端口为9200discovery.zen.ping.unicast.hosts: ["node1", "node2"] ##第68行, 集群发现通过单播实现,指定要发现的节点 node1、node2 [root@node1 opt]#grep -v "^#" /etc/elasticsearch/elasticsearch.ymlcluster.name: my-elk-clusternode.name: node1path.data: /data/elk_datapath.logs: /var/log/elasticsearch/bootstrap.memory_lock: falsenetwork.host: 0.0.0.0http.port: 9200discovery.zen.ping.unicast.hosts: ["node1", "node2"]4.创建数据存放路径并授权,启动服务并查看端口是否开启
mkdir -p /data/elk_data ##创建数据存放路径chown elasticsearch:elasticsearch /data/elk_data/ ##给数据存放路径赋予权限systemctl start elasticsearch.service ##启动比较慢,需要等待netstat -natp | grep 9200 ##过滤端口tcp6 0 0 :::9200 :::* LISTEN 37606/java5.查看节点信息
浏览器访问 http://192.168.10.100:9200 、 http://192.168.10.101:9200 查看节点 Node1、Node2 的信息。 浏览器访问 http://192.168.10.100:9200/_cluster/health?pretty 、 http://192.168.10.101:9200/_cluster/health?pretty查看群集的健康情况,可以看到 status 值为 green(绿色), 表示节点健康运行。 #使用上述方式查看群集的状态对用户并不友好,可以通过安装 Elasticsearch-head 插件,可以更方便地管理群集。 绿色:健康 数据和副本 全都没有问题红色:数据都不完整黄色:数据完整,但副本有问题3、安装ElasticSearch-head插件(在node1节点上操作)
1.编译安装node1
#上传软件包 node-v8.2.1.tar.gz 到/optyum install gcc gcc-c++ make -ycd /optrz -Etar zxvf node-v8.2.1.tar.gzcd node-v8.2.1/./configuremake -j4 && make install2.安装phantomjs(前端框架)
[root@node1 opt]#lselasticsearch-5.5.0.rpm kibana-5.5.1-x86_64.rpm node-v8.2.1.tar.gz rhelasticsearch-head.tar.gz node-v8.2.1 phantomjs-2.1.1-linux-x86_64.tar.bz2[root@node1 opt]#tar jxf phantomjs-2.1.1-linux-x86_64.tar.bz2 -C /usr/local/src/[root@node1 opt]#cd /usr/local/src/phantomjs-2.1.1-linux-x86_64/bin/[root@node1 bin]#lsphantomjs[root@node1 bin]#cp phantomjs /usr/local/bin/3.安装ElasticSearch-head数据可视化工具
[root@node1 opt]#lselasticsearch-5.5.0.rpm kibana-5.5.1-x86_64.rpm node-v8.2.1.tar.gz rhelasticsearch-head.tar.gz node-v8.2.1 phantomjs-2.1.1-linux-x86_64.tar.bz2[root@node1 opt]#tar xf elasticsearch-head.tar.gz -C /usr/local/src/[root@node1 opt]#cd /usr/local/src/elasticsearch-head/[root@node1 elasticsearch-head]#lsDockerfile Gruntfile.js LICENCE package-lock.json README.textile testDockerfile-alpine grunt_fileSets.js node_modules plugin-descriptor.properties _siteelasticsearch-head.sublime-project index.html package.json proxy src[root@node1 elasticsearch-head]#npm installnpm WARN deprecated fsevents@1.2.13: The v1 package contains DANGEROUS / INSECURE binaries. Upgrade to safe fsevents v2npm WARN optional SKIPPING OPTIONAL DEPENDENCY: fsevents@^1.0.0 (node_modules/karma/node_modules/chokidar/node_modules/fsevents):npm WARN notsup SKIPPING OPTIONAL DEPENDENCY: Unsupported platform for fsevents@1.2.13: wanted {"os":"darwin","arch":"any"} (current: {"os":"linux","arch":"x64"})npm WARN elasticsearch-head@0.0.0 license should be a valid SPDX license expression up to date in 5.63s4.修改ElasticSearch主配置文件
[root@node1 opt]#vim /etc/elasticsearch/elasticsearch.yml ##修改 Elasticsearch 主配置文件 --末尾添加以下内容--http.cors.enabled: true#开启跨域访问支持,默认为 falsehttp.cors.allow-origin: "*"#指定跨域访问允许的域名地址为所有 systemctl restart elasticsearch ##重启elasticsearch服务5.启动ElasticSearch-head服务
#必须在解压后的 elasticsearch-head 目录下启动服务,进程会读取该目录下的 gruntfile.js 文件,否则可能启动失败。cd /usr/local/src/elasticsearch-head/npm run start & > elasticsearch-head@0.0.0 start /usr/local/src/elasticsearch-head> grunt server Running "connect:server" (connect) taskWaiting forever...Started connect web server on http://localhost:9100 #elasticsearch-head 监听的端口是 9100ss -natp |grep 91006.通过ELasticSearch-head查看ElasticSearch信息
通过浏览器访问 http://192.168.10.100:9100/ 地址并连接群集。如果看到群集健康值为 green 绿色,代表群集很健康。注意:有的时候显示未连接,这时将 localhost 改成 IP 地址即可
7.插入索引
#通过命令插入一个测试索引,索引为 index-demo,类型为 test。curl -X PUT 'localhost:9200/index-demo1/test/1?pretty&pretty' -H 'content-Type: application/json' -d '{"user":"zhangsan","mesg":"hello world"}' //输出结果如下:{"_index" : "index-demo","_type" : "test","_id" : "1","_version" : 1,"result" : "created","_shards" : {"total" : 2,"successful" : 2,"failed" : 0},"created" : true}
8.浏览器查看索引信息
浏览器访问 http://192.168.10.100:9100/ 查看索引信息,可以看见索引默认被分片5个,并且有一个副本。点击“数据浏览”,会发现在node1上创建的索引为 index-demo,类型为 test 的相关信息。4、ELK Logstash部署(在APache节点上操作)
1.安装Apache服务(httpd)
yum install httpd -y ##安装Apache服务2.安装java环境
[root@logstash opt]#java -versionopenjdk version "1.8.0_131"OpenJDK Runtime Environment (build 1.8.0_131-b12)OpenJDK 64-Bit Server VM (build 25.131-b12, mixed mode)3.安装Logstash
[root@logstash ~]#cd /opt/[root@logstash opt]#rz -Erz waiting to receive.[root@logstash opt]#lslogstash-5.5.1.rpm rh[root@logstash opt]#rpm -ivh logstash-5.5.1.rpm 警告:logstash-5.5.1.rpm: 头V4 RSA/SHA512 Signature, 密钥 ID d88e42b4: NOKEY准备中... ################################# [100%]正在升级/安装... 1:logstash-1:5.5.1-1 ################################# [100%]Using provided startup.options file: /etc/logstash/startup.optionsSuccessfully created system startup script for Logstash [root@logstash opt]#ln -s /usr/share/logstash/bin/logstash /usr/local/bin/ ##做软链接4.测试Logstash
[root@logstash ~]#systemctl start logstash.service ##首先开启服务[root@logstash ~]#systemctl enable logstash.service[root@logstash ~]#systemctl status logstash.service ● logstash.service - logstash Loaded: loaded (/etc/systemd/system/logstash.service; disabled; vendor preset: disabled) Active: active (running) since 三 2024-04-10 22:42:12 CST; 3s ago Main PID: 5783 (java) CGroup: /system.slice/logstash.service └─5783 /usr/bin/java -XX:+UseParNewGC -XX:+UseConcMarkSweepGC -XX:CMSInitiatingOccupancyFraction=75 -XX:+U... 4月 10 22:42:12 logstash systemd[1]: Started logstash.4月 10 22:42:12 logstash systemd[1]: Starting logstash...##定义输入和输出流:##输入采用标准输入,输出采用标准输出(类似管道)##logstash -e 'input { stdin{} } output { stdout{} }' [root@logstash ~]#logstash -e 'input { stdin{} } output { stdout{} }'ERROR StatusLogger No log4j2 configuration file found. Using default configuration: logging only errors to the console.WARNING: Could not find logstash.yml which is typically located in $LS_HOME/config or /etc/logstash. You can specify the path using --path.settings. Continuing using the defaultsCould not find log4j2 configuration at path //usr/share/logstash/config/log4j2.properties. Using default config which logs to console22:45:31.013 [main] INFO logstash.setting.writabledirectory - Creating directory {:setting=>"path.queue", :path=>"/usr/share/logstash/data/queue"}22:45:31.016 [main] INFO logstash.setting.writabledirectory - Creating directory {:setting=>"path.dead_letter_queue", :path=>"/usr/share/logstash/data/dead_letter_queue"}22:45:31.043 [LogStash::Runner] INFO logstash.agent - No persistent UUID file found. Generating new UUID {:uuid=>"c93492d0-eb1a-4fb2-a962-69e4952cbc77", :path=>"/usr/share/logstash/data/uuid"}22:45:31.203 [[main]-pipeline-manager] INFO logstash.pipeline - Starting pipeline {"id"=>"main", "pipeline.workers"=>4, "pipeline.batch.size"=>125, "pipeline.batch.delay"=>5, "pipeline.max_inflight"=>500}22:45:31.259 [[main]-pipeline-manager] INFO logstash.pipeline - Pipeline main startedThe stdin plugin is now waiting for input:22:45:31.328 [Api Webserver] INFO logstash.agent - Successfully started Logstash API endpoint {:port=>9600} www.baidu.com2024-04-10T14:47:32.349Z logstash www.baidu.comrubydebug 输出:#使用 rubydebug 输出详细格式显示,codec 为一种编解码器logstash -e 'input { stdin{} } output { stdout{ codec=>rubydebug } }' [root@logstash ~]#logstash -e 'input { stdin{} } output { stdout{ codec=>rubydebug } }'ERROR StatusLogger No log4j2 configuration file found. Using default configuration: logging only errors to the console.WARNING: Could not find logstash.yml which is typically located in $LS_HOME/config or /etc/logstash. You can specify the path using --path.settings. Continuing using the defaultsCould not find log4j2 configuration at path //usr/share/logstash/config/log4j2.properties. Using default config which logs to console22:55:57.519 [[main]-pipeline-manager] INFO logstash.pipeline - Starting pipeline {"id"=>"main", "pipeline.workers"=>4, "pipeline.batch.size"=>125, "pipeline.batch.delay"=>5, "pipeline.max_inflight"=>500}22:55:57.538 [[main]-pipeline-manager] INFO logstash.pipeline - Pipeline main startedThe stdin plugin is now waiting for input:22:55:57.621 [Api Webserver] INFO logstash.agent - Successfully started Logstash API endpoint {:port=>9600}www.baidu.com{ "@timestamp" => 2024-04-10T14:56:14.400Z, "@version" => "1", "host" => "logstash", "message" => "www.baidu.com"}输出到 ES:#使用 Logstash 将信息写入 Elasticsearch 中logstash -e 'input { stdin{} } output { elasticsearch { hosts=>["192.168.10.100:9200"] } }'[root@logstash ~]#logstash -e 'input { stdin{} } output { elasticsearch { hosts=>["192.168.10.100:9200"] } }'ERROR StatusLogger No log4j2 configuration file found. Using default configuration: logging only errors to the console.WARNING: Could not find logstash.yml which is typically located in $LS_HOME/config or /etc/logstash. You can specify the path using --path.settings. Continuing using the defaultsCould not find log4j2 configuration at path //usr/share/logstash/config/log4j2.properties. Using default config which logs to console23:13:22.928 [[main]-pipeline-manager] INFO logstash.outputs.elasticsearch - Elasticsearch pool URLs updated {:changes=>{:removed=>[], :added=>[http://192.168.10.100:9200/]}}23:13:22.931 [[main]-pipeline-manager] INFO logstash.outputs.elasticsearch - Running health check to see if an Elasticsearch connection is working {:healthcheck_url=>http://192.168.10.100:9200/, :path=>"/"}23:13:23.004 [[main]-pipeline-manager] WARN logstash.outputs.elasticsearch - Restored connection to ES instance {:url=>#<Java::JavaNet::URI:0x65334761>}23:13:23.005 [[main]-pipeline-manager] INFO logstash.outputs.elasticsearch - Using mapping template from {:path=>nil}23:13:23.238 [[main]-pipeline-manager] INFO logstash.outputs.elasticsearch - Attempting to install template {:manage_template=>{"template"=>"logstash-*", "version"=>50001, "settings"=>{"index.refresh_interval"=>"5s"}, "mappings"=>{"_default_"=>{"_all"=>{"enabled"=>true, "norms"=>false}, "dynamic_templates"=>[{"message_field"=>{"path_match"=>"message", "match_mapping_type"=>"string", "mapping"=>{"type"=>"text", "norms"=>false}}}, {"string_fields"=>{"match"=>"*", "match_mapping_type"=>"string", "mapping"=>{"type"=>"text", "norms"=>false, "fields"=>{"keyword"=>{"type"=>"keyword", "ignore_above"=>256}}}}}], "properties"=>{"@timestamp"=>{"type"=>"date", "include_in_all"=>false}, "@version"=>{"type"=>"keyword", "include_in_all"=>false}, "geoip"=>{"dynamic"=>true, "properties"=>{"ip"=>{"type"=>"ip"}, "location"=>{"type"=>"geo_point"}, "latitude"=>{"type"=>"half_float"}, "longitude"=>{"type"=>"half_float"}}}}}}}}23:13:23.253 [[main]-pipeline-manager] INFO logstash.outputs.elasticsearch - New Elasticsearch output {:class=>"LogStash::Outputs::ElasticSearch", :hosts=>[#<Java::JavaNet::URI:0x67ed24a3>]}23:13:23.285 [[main]-pipeline-manager] INFO logstash.pipeline - Starting pipeline {"id"=>"main", "pipeline.workers"=>4, "pipeline.batch.size"=>125, "pipeline.batch.delay"=>5, "pipeline.max_inflight"=>500}The stdin plugin is now waiting for input:23:13:23.420 [[main]-pipeline-manager] INFO logstash.pipeline - Pipeline main started23:13:23.541 [Api Webserver] INFO logstash.agent - Successfully started Logstash API endpoint {:port=>9600}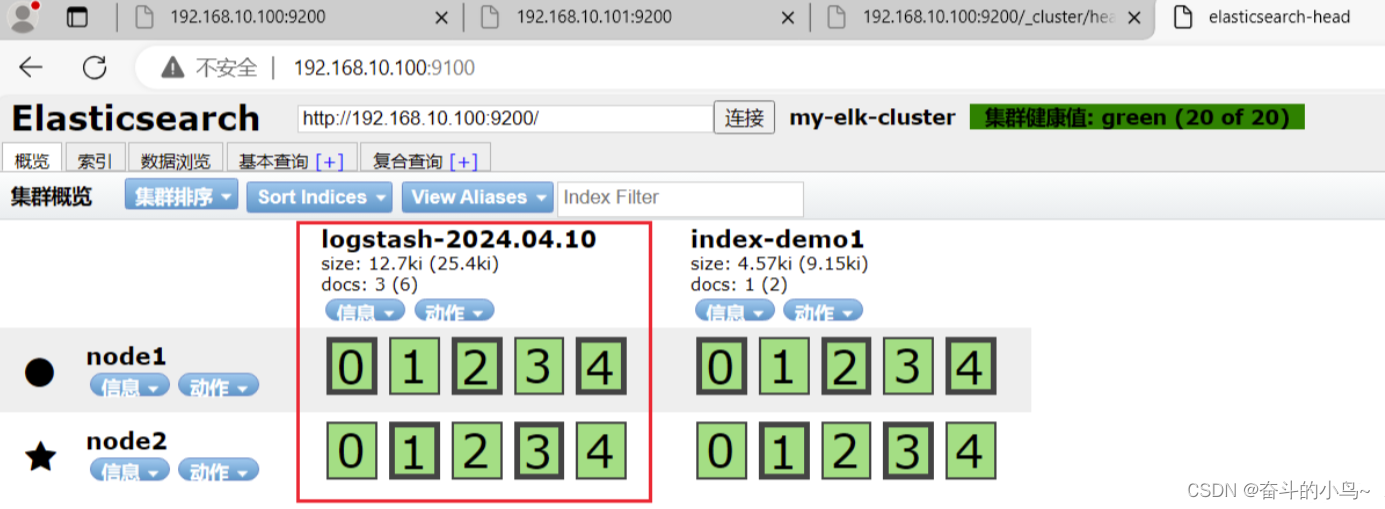
5.定义Logstash配置文件
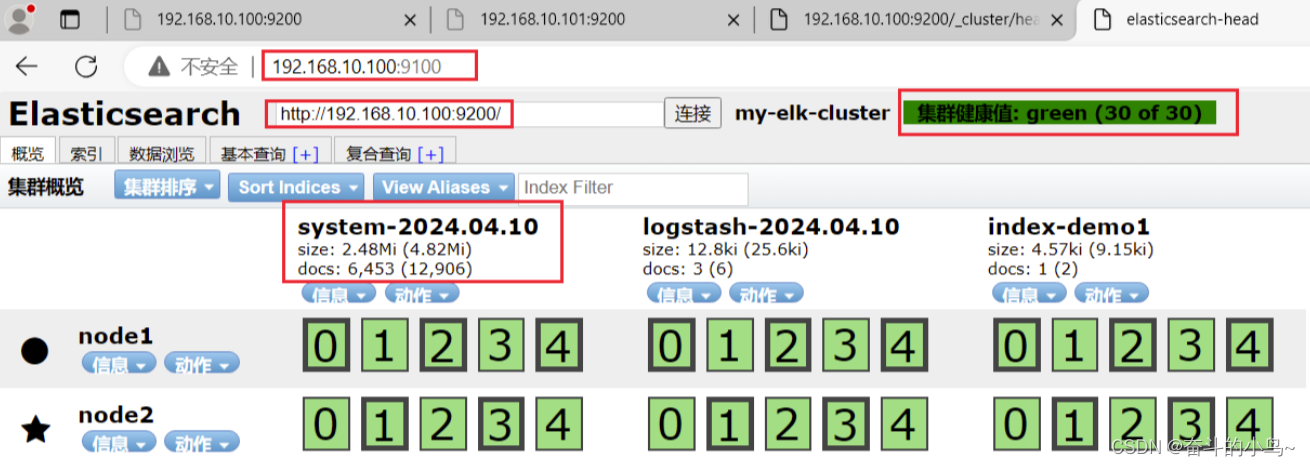
#修改 Logstash 配置文件,让其收集系统日志/var/log/messages,并将其输出到 elasticsearch 中。chmod +r /var/log/messages#让 Logstash 可以读取日志 vim /etc/logstash/conf.d/system.conf #该文件需自行创建,文件名可自定义input { file{ path =>"/var/log/messages"#指定要收集的日志的位置 type =>"system"#自定义日志类型标识 start_position =>"beginning"#表示从开始处收集 }}output { elasticsearch {#输出到 elasticsearch hosts => [ "192.168.10.100:9200" ]#指定 elasticsearch 服务器的地址和端口 index =>"system-%{+YYYY.MM.dd}"#指定输出到 elasticsearch 的索引格式 }} systemctl restart logstash 6.浏览器访问查看索引信息
浏览器访问 http://192.168.79.26:9100 查看索引信息
5、ELK Kibana部署(在node1节点上操作)
1.安装Kibana
下载地址:https://www.elastic.co/cn/downloads/past-releases/kibana-5-5-1[root@node1 ~]#cd /opt/[root@node1 opt]#lselasticsearch-5.5.0.rpm kibana-5.5.1-x86_64.rpm node-v8.2.1.tar.gz rhelasticsearch-head.tar.gz node-v8.2.1 phantomjs-2.1.1-linux-x86_64.tar.bz2[root@node1 opt]#rpm -ivh kibana-5.5.1-x86_64.rpm 警告:kibana-5.5.1-x86_64.rpm: 头V4 RSA/SHA512 Signature, 密钥 ID d88e42b4: NOKEY准备中... ################################# [100%]正在升级/安装... 1:kibana-5.5.1-1 ################################# [100%]2.设置Kibana的主配置文件
cp /etc/kibana/kibana.yml /etc/kibana/kibana.yml.bak ##给匹配值文件做备份vim /etc/kibana/kibana.yml ##设置 Kibana 的主配置文件---------------------------------------------------------------------------------------------server.port: 5601 ##第2行, 取消注释,Kiabana 服务的默认监听端口为5601server.host: "0.0.0.0" ##第7行, 取消注释,设置 Kiabana 的监听地址,0.0.0.0代表所有地址elasticsearch.url: "http://192.168.10.100:9200" ##第21行,取消注释,设置和 Elasticsearch 建立连接的地址和端口kibana.index: ".kibana" ##第30行,取消注释,设置在 elasticsearch 中添加.kibana索引3.启动Kibana服务
[root@node1 opt]#systemctl start kibana.service [root@node1 opt]#systemctl enable kibana.service Created symlink from /etc/systemd/system/multi-user.target.wants/kibana.service to /etc/systemd/system/kibana.service.[root@node1 opt]#lsof -i:5601COMMAND PID USER FD TYPE DEVICE SIZE/OFF NODE NAMEnode 2332 kibana 11u IPv4 32050 0t0 TCP *:esmagent (LISTEN)[root@node1 opt]#netstat -natp | grep 5601tcp 0 0 0.0.0.0:5601 0.0.0.0:* LISTEN 2332/node4.验证Kibana
浏览器访问 http://192.168.10.100:5601


5.将Apache服务器的日志(访问的、错误的)添加到ES并通过Kibana显示
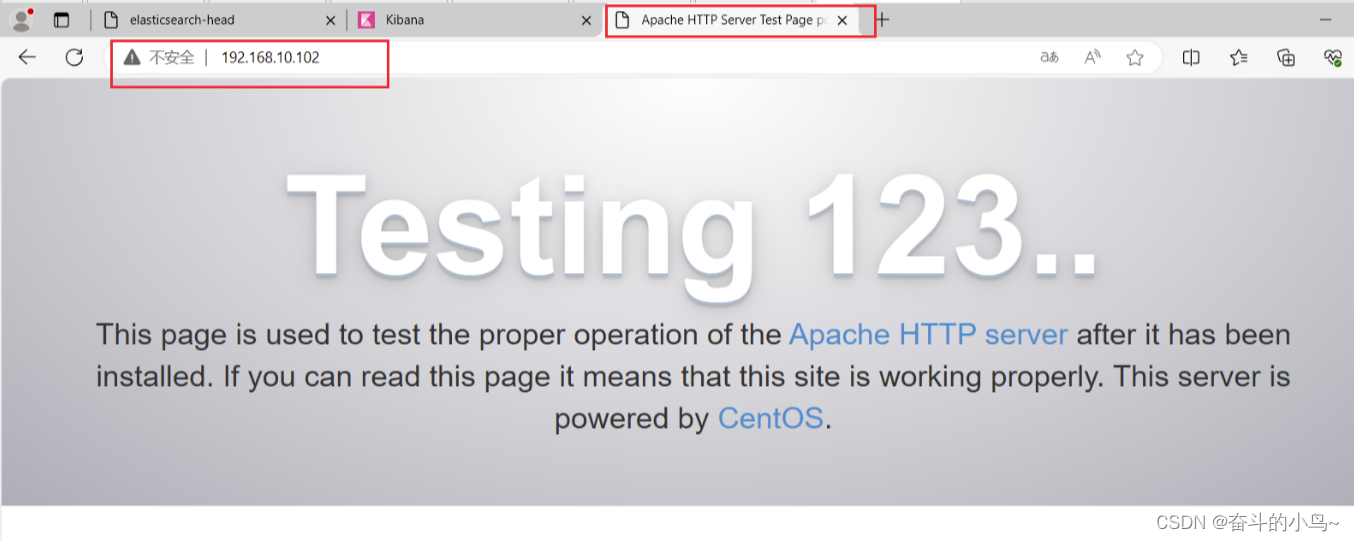
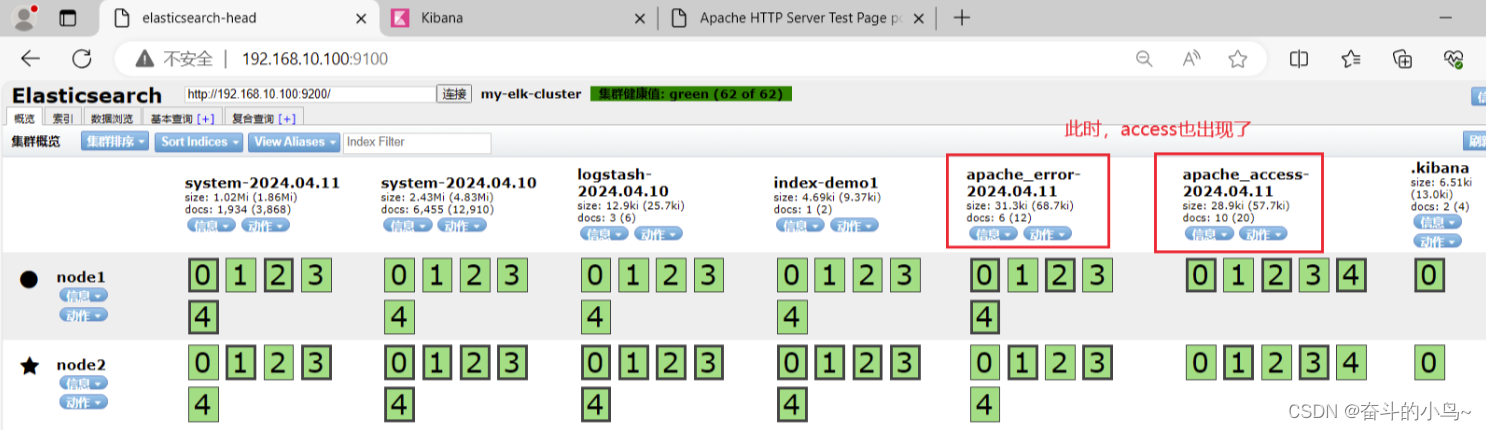
[root@logstash ~]#systemctl status httpd.service[root@logstash ~]#systemctl start httpd.service [root@logstash ~]#systemctl status httpd.service[root@logstash conf.d]#vim /etc/logstash/conf.d/apache_log.conf file { path => "/etc/httpd/logs/access_log" type => "access" start_position => "beginning" } file { path => "/etc/httpd/logs/error_log" type => "error" start_position => "beginning" } } output { if [type] == "access" { elasticsearch { hosts => ["192.168.10.100:9200"] index => "apache_access-%{+YYYY.MM.dd}" } } if [type] == "error" { elasticsearch { hosts => ["192.168.10.100:9200"] index => "apache_error-%{+YYYY.MM.dd}" } } } cd /etc/logstash/conf.d//usr/share/logstash/bin/logstash -f apache_log.conf6.浏览器访问 http://192.168.10.100:9100 查看索引是否创建
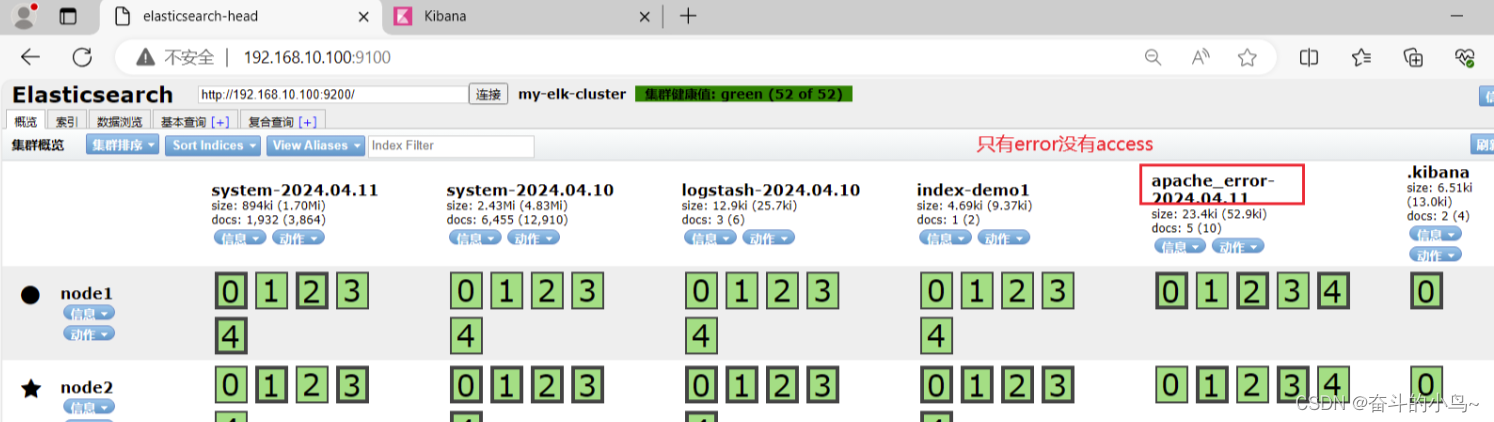
需要访问Apache页面,才会出现access
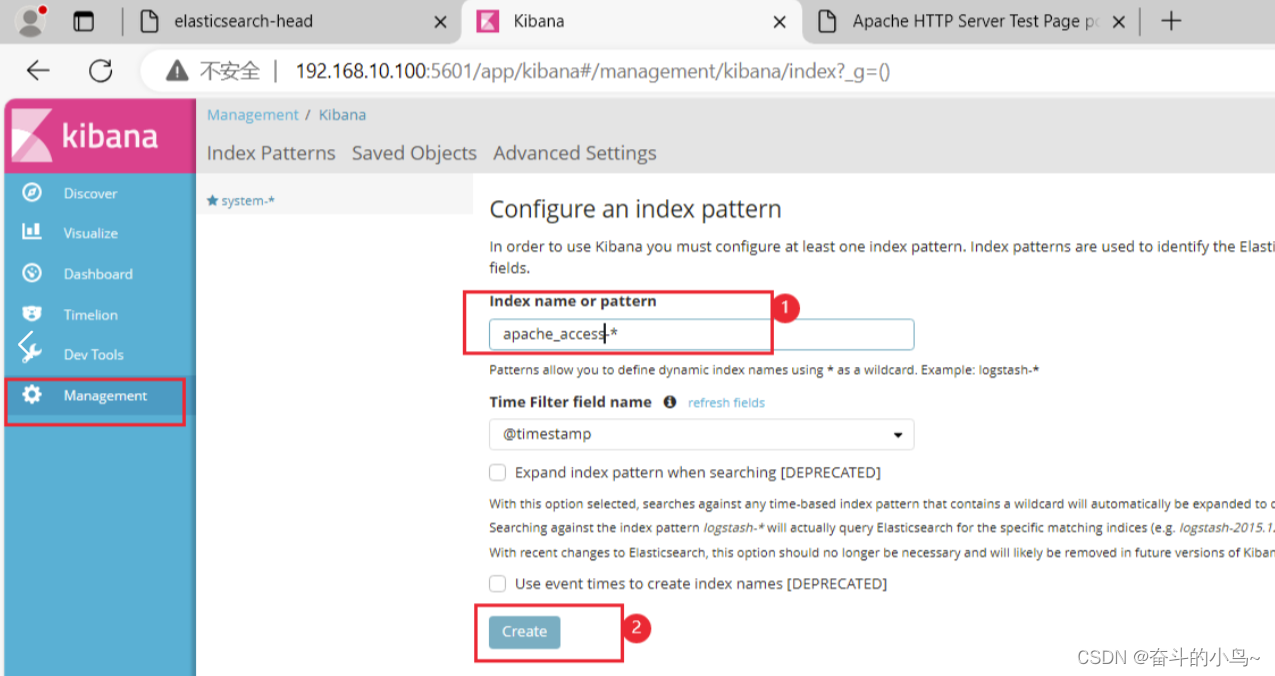
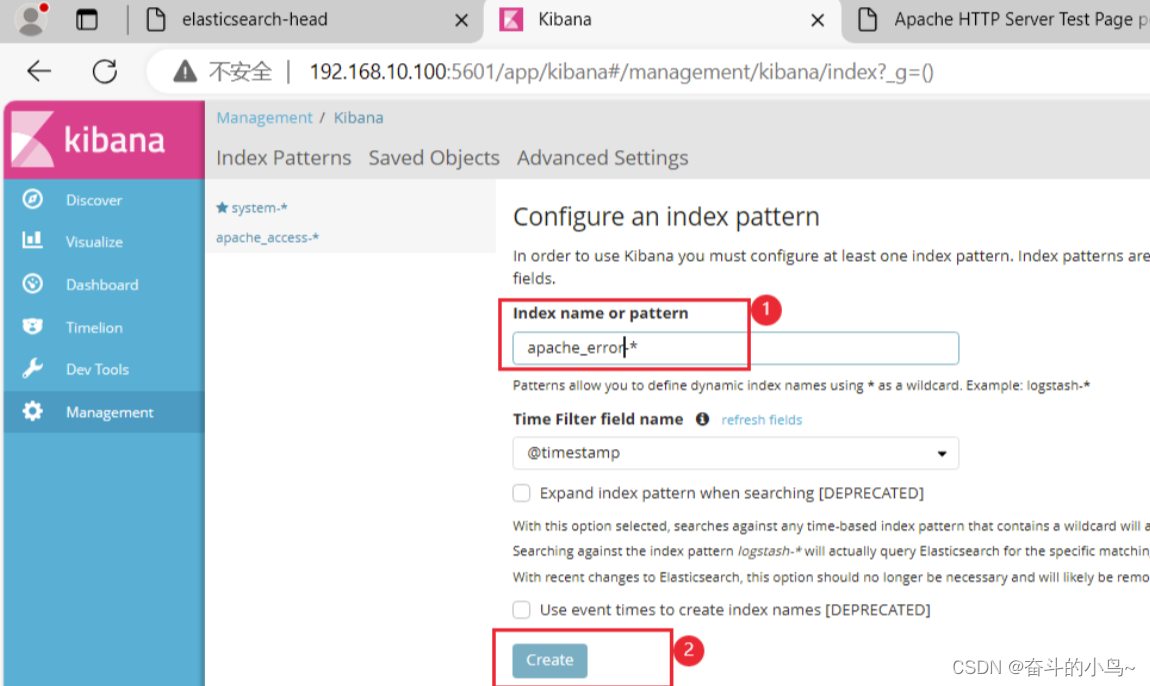
7.浏览器访问 http://192.168.10.100:5601 登录 Kibana
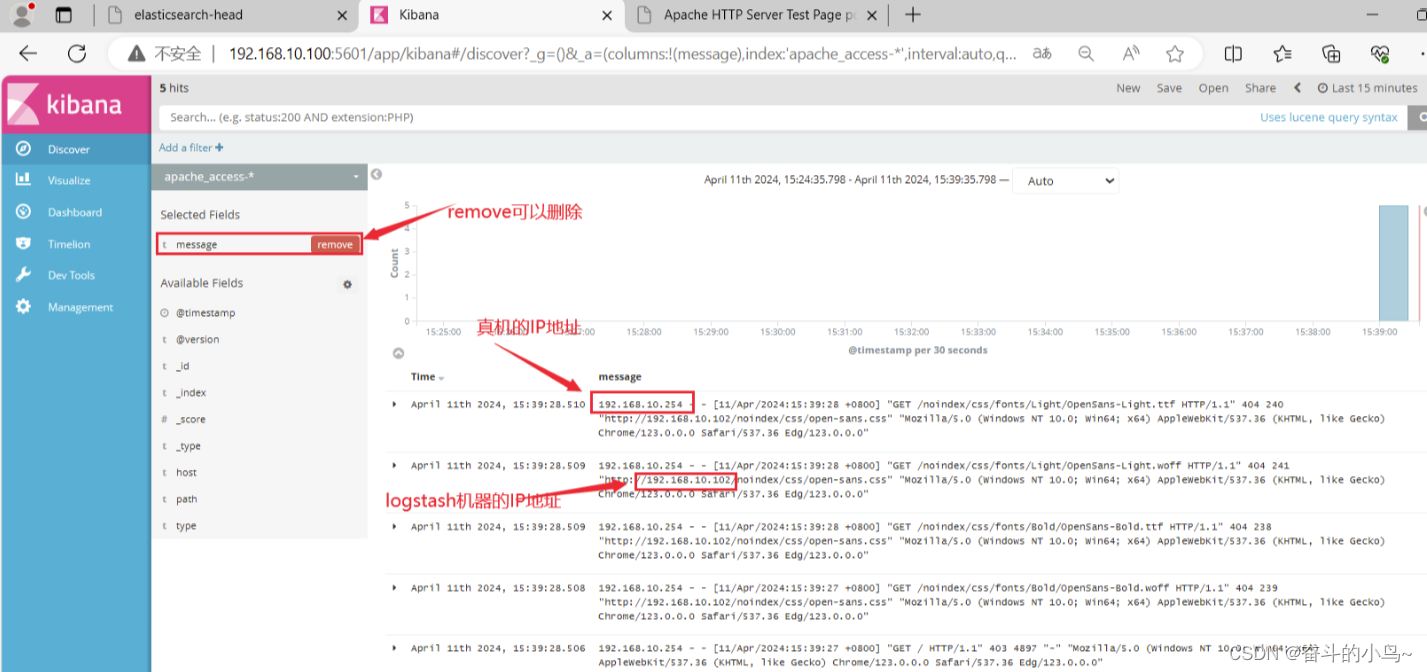
敬请期待后续