目录
一 基金监控项目实践1.设计思想1.1 实现一个基金分析月内走势图1.2 输入编号可以展示对应信息1.3设计思路 2.前端设计2.1 H5 编写2.2 CSS 编写 3.后端设计4.爬虫程序设计5.可视化图表设计6.数据传输设计7.后台编写8.总结
一 基金监控项目实践
1.设计思想
技术点:前端 + 爬虫 + 后端 + 可视化
想找到博主沟通以及拿博主资料代码的戳蓝字
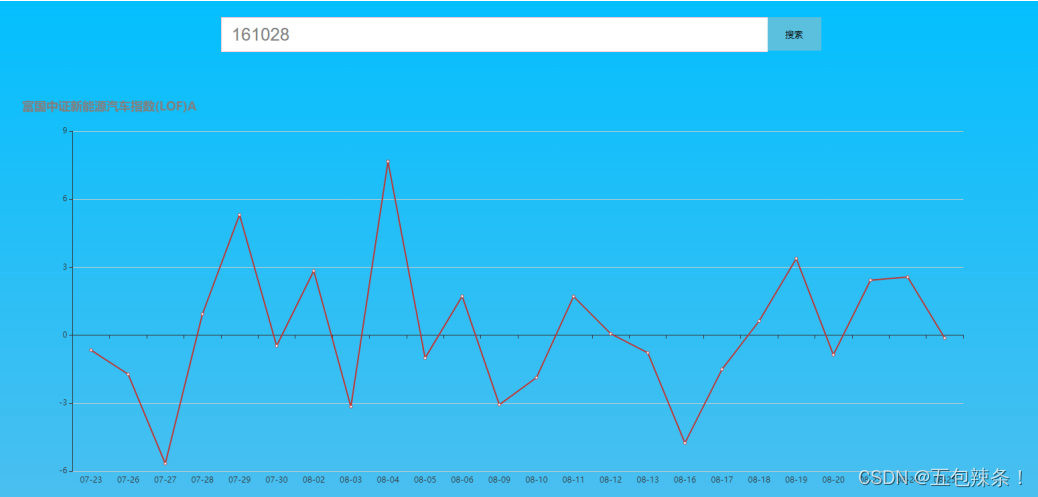
1.1 实现一个基金分析月内走势图
1.2 输入编号可以展示对应信息
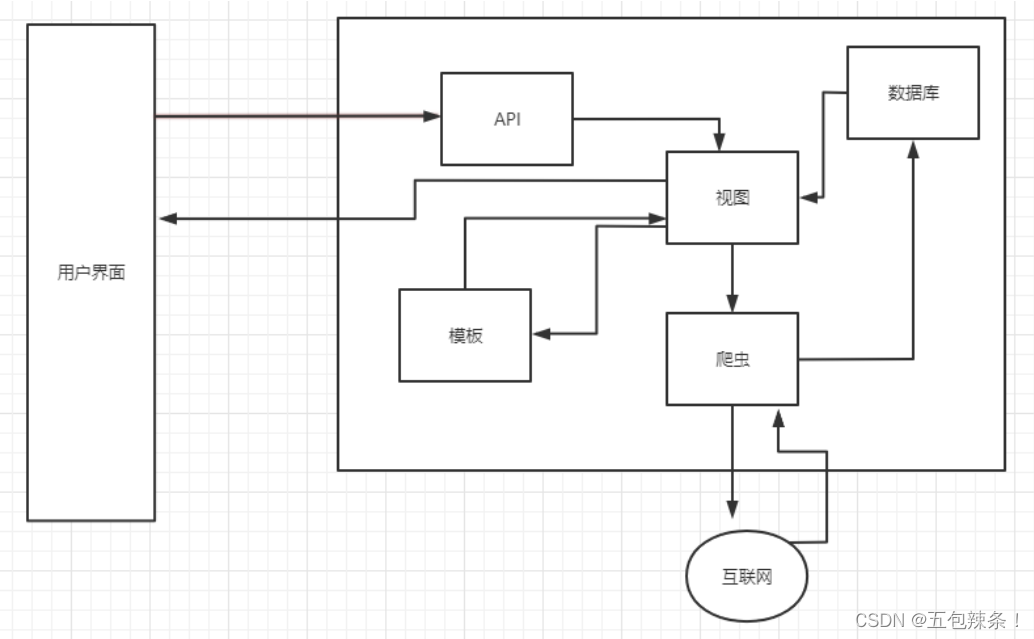
1.3设计思路
2.前端设计
margin 外边距 padding 内边距 flex 弹性布局<script src="https://cdn.bootcss.com/jquery/3.4.1/jquery.min.js"></script><script src="https://cdn.bootcss.com/echarts/3.7.1/echarts.min.js"></script>2.1 H5 编写
<body><!--搜索框 --><div class="box w"><input type="text" placeholder="输入基金编号"><button id="btn">搜索</button></div><!--数据展示层 --><div id="data" class="w"></div></body>2.2 CSS 编写
*{margin: 0;padding: 0;}body{-moz-user-select : none;user-select : none;background: -webkit-linear-gradient(deepskyblue, pink); /* 颜色从上到下 */}.w{width: 1500px;height: auto;margin: auto;}.box{display: flex;height: 60px;margin-top: 60px;justify-content: center;}.box input{width: 800px;height: 50px;font-size: 26px;border: 1px solid pink;border-right: 0;padding-left: 15px;color: gray;}.box #btn{width: 80px;height: 50px;background-color: #5bc0de;border: 2px solid #5bc0de;cursor: pointer;}#data{height: 600px;margin-top: 60px;}3.后端设计
@xl.route('/')def index():return render_template('xl.html')4.爬虫程序设计
根据编号提取标题def data_crawl(code):global titletry:code = codeurl = 'http://fund.eastmoney.com/js/fundcode_search.js'res = requests.get(url).textles1 = re.findall('var r = (.*?);', res)data = eval(les1[0])title = Nonefor i in data:if code == i[0]:title = i[2]url = f'https://danjuanapp.com/djapi/fund/nav-growth/{code}?day=30'headers = {'User-Agent': 'Mozilla/5.0 (Windows NT 6.3; Win64; x64;rv:84.0) Gecko/20100101 Firefox/84.0'}res = requests.get(url, headers=headers)res.encoding = 'utf-8'data = json.loads(res.text)s = data['data']['fund_nav_growth']times = []prices = []for i in s:date = i.get('date')t = date.replace(date.split('-')[0]+'-','')price = i.get('gr_per')times.append(t)prices.append(price)return {'time':times,'price':prices,'title':title}except Exception as e:print(e)return None5.可视化图表设计
官网:https://echarts.apache.org/examples/zh/index.html#chart-type-line code编写<script>option = {title:{text:"洛哥是最帅的",},tooltip:{trigger:'axis',axisPointer: {type:'line',lineStyle:{color:'red'}}},xAxis: {type: 'category',data: ['Mon', 'Tue', 'Wed', 'Thu', 'Fri', 'Sat', 'Sun']},yAxis: {type: 'value'},series: [{data: [150, 230, 224, 218, 135, 147, 260],type: 'line'}]};var ff = echarts.init(document.getElementById('data'));ff.setOption(option)</script>6.数据传输设计
_oxab();function _oxab(){$('#btn').click(function (){var rpPmPKjn1 = $('.box input').val();Dats = { 'data': rpPmPKjn1 };$.ajax({url: '/api',type: 'GET',data: Dats,success: function (res){console.log(res);xl_option.title.text = res.data.title;xl_option.xAxis.data = res.data.time;xl_option.series[0].data = res.data.price;ec_left.setOption(xl_option);},error: function (){window.alert('alax执行错误');}});});}7.后台编写
@xl.route('/api')def api():args = request.args.get('data')data = data_crawl(args)return jsonify({'data': data})
8.总结
好久没有更新了~最近实在太忙,但是今天开始只要有时间我就会来上一发,希望多多支持 ~其次大家想找我的文末底下就有我名片,直接找我即可!包括博主以前的一些文章代码资料的都可以找我拿的!还能围观博主的直播企业级案例解析! |