参考博客:
(83条消息) plt: subplot()、subplots()详解及返回对象figure、axes的理解_涛涛ALG的博客-CSDN博客_plt.subplot参数 https://blog.csdn.net/sunjintaoxxx/article/details/121098302(83条消息) plt.subplot()函数解析(最清晰的解释)_我是管小亮的博客-CSDN博客_plt.subplot
 https://blog.csdn.net/TeFuirnever/article/details/89842795
正文:
plt.subplot()函数用于直接制定划分方式和位置进行绘图。
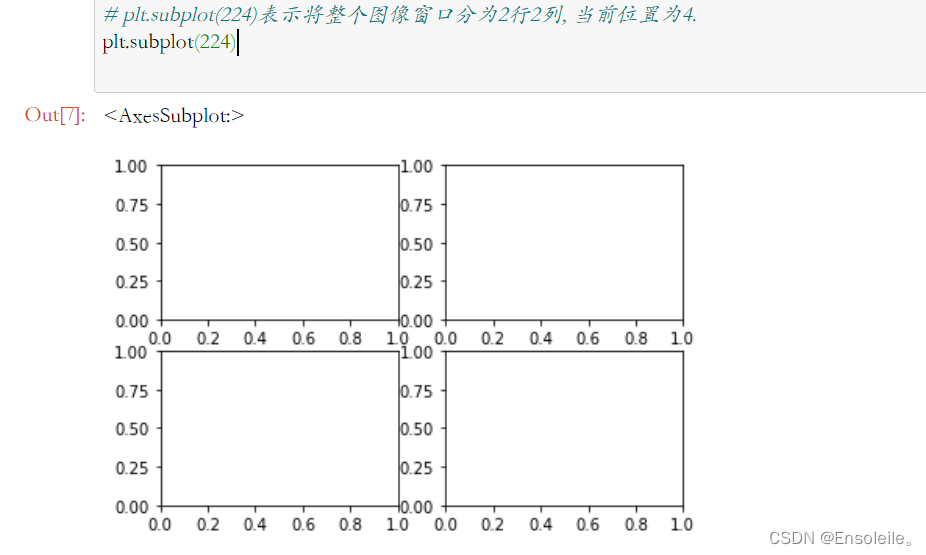
函数原型 subplot(nrows, ncols, index, **kwargs),一般我们只用到前三个参数,将整个绘图区域分成 nrows 行和 ncols 列,而 index 用于对子图进行编号。
import numpy as np
import matplotlib.pyplot as plt
# 使用plt.subplot来创建小图.
plt.figure(1)
#plt.subplot(221)表示将整个图像窗口分为2行2列, 当前位置为1.
plt.subplot(221)
# plt.subplot(222)表示将整个图像窗口分为2行2列, 当前位置为2.
plt.subplot(222) # 第一行的右图
# plt.subplot(223)表示将整个图像窗口分为2行2列, 当前位置为3.
plt.subplot(223)
# plt.subplot(224)表示将整个图像窗口分为2行2列, 当前位置为4.
plt.subplot(224)

注意:
1. 如果不指定figure()的轴,figure(1)命令默认会被建立,同样的,如果不指定subplot(nrows,ncols,index)的轴,subplot(111)也会自动建立。
2. 参数111,可以写为111,也可以用逗号分隔开,写为(1,1,1);当然,官方规定,当子区域不超过9个的时候,才可以简写为111。其中,第一个参数代表子图的行数,第二个参数代表该行图像的列数,第三个参数代表每行的第几个图像。
范例:
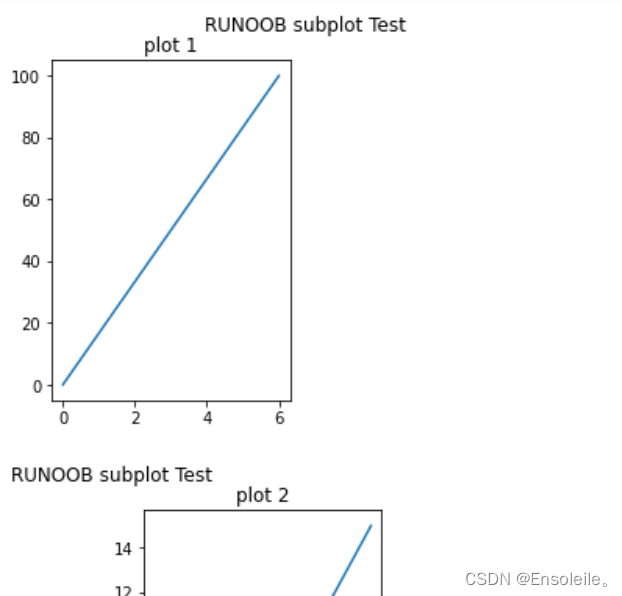
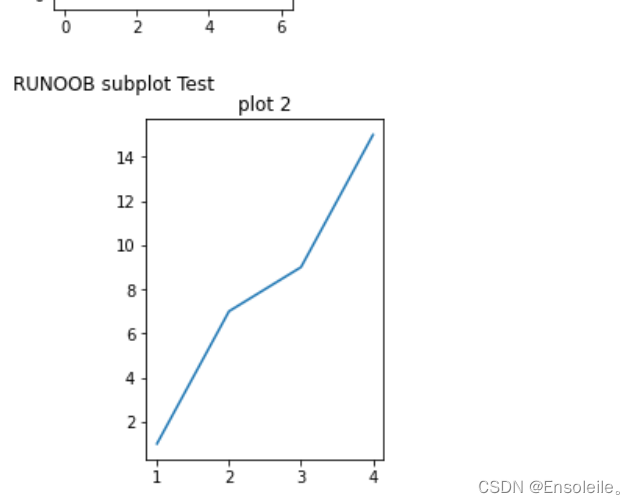
import matplotlib.pyplot as pltimport numpy as np#f1,plot 1:xpoints = np.array([0, 6])ypoints = np.array([0, 100])plt.figure(1)plt.subplot(1, 2, 1)plt.plot(xpoints,ypoints)plt.title("plot 1")plt.suptitle("RUNOOB subplot Test")#f2,plot 2:x = np.array([1, 2, 3, 4])y = np.array([1, 7, 9, 15])plt.figure(2)plt.subplot(1, 2, 2)plt.plot(x,y)plt.title("plot 2")plt.suptitle("RUNOOB subplot Test")plt.show()输出图像:

