【MATLAB第2期】源码分享#基于LSTM时间序列单步预测,含验证和预测未来
文章标签:
《随便一记》
【MATLAB第2期】源码分享#基于LSTM时间序列单步预测,含验证和预测未来
1.运行环境
matlab2020a + cpu
2.数据说明
单列数据,2018/10~2018/12 共三个月,92个数据。
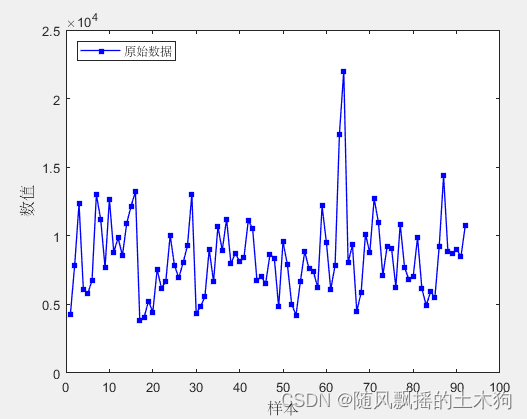
3.数据处理
样本标准化处理,其中,前85个数据作为训练样本,来验证后7个数据效果。最后预测未来7个数据。
numTimeStepsTrain = floor(85);%85数据训练 ,7个用来验证
dataTrain = data(1:numTimeStepsTrain+1,:);% 训练样本
dataTest = data(numTimeStepsTrain:end,:); %验证样本
4.LSTM参数设置
numHiddenUnits = 500;%隐含层神经元节点数
dropoutLayer(0.2)%丢弃层概率
5.运行过程
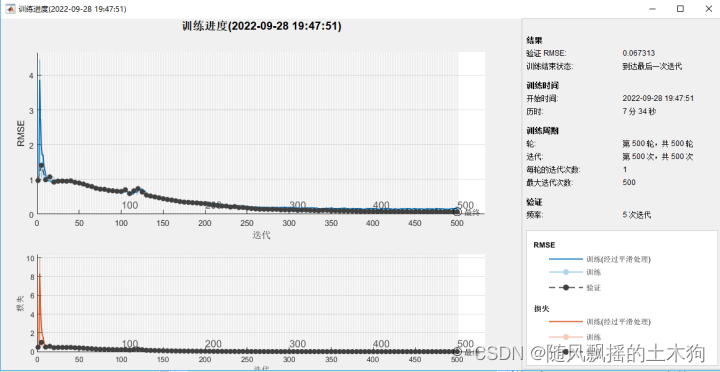
根据训练效果RMSE误差图以及损失图,可在运行时降低训练次数,如设置为300,加快收敛。
6.运行结果
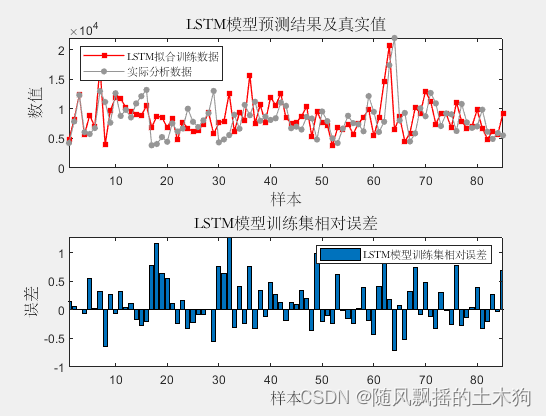
训练结果:
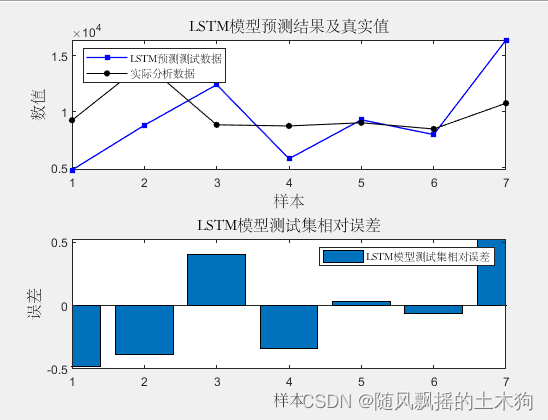
验证结果:
评价指标:
训练集数据的MAE为:2524.5837
验证集数据的MAE为:3277.468
训练集数据的MAPE为:0.3253
验证集数据的MAPE为:0.31752
训练集数据的RMSE为:3380.5039
验证集数据的RMSE为:3862.0957
原数据量级比较大,加上参数还需要打磨,所以误差显得比较大 。可以套用自己数据试试。
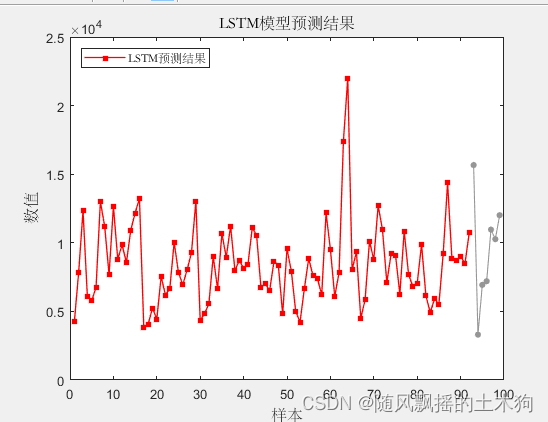
7.预测未来
展示代码:
调用函数以及案例数据可后台私聊回复“第二期”获取下载链接了,免费下载即可。
内容整理不易,求个关注,后续会持续分享机器学习相关的源代码。
%% 1.环境清理clear, clc, close all;%% 2.导入数据data=xlsread('data.csv');data1=data;% 原始数据绘图figureplot(data,'-s','Color',[0 0 255]./255,'linewidth',1,'Markersize',5,'MarkerFaceColor',[0 0 255]./255)legend('原始数据','Location','NorthWest','FontName','华文宋体');xlabel('样本','fontsize',12,'FontName','华文宋体');ylabel('数值','fontsize',12,'FontName','华文宋体');%% 3.数据处理numTimeStepsTrain = floor(85);%85数据训练 ,7个用来验证[XTrain,YTrain,XTest,YTest,mu,sig] = shujuchuli(data,numTimeStepsTrain);%% 4.定义LSTM结构参数numFeatures= 1;%输入节点numResponses = 1;%输出节点numHiddenUnits = 500;%隐含层神经元节点数 %构建 LSTM网络 layers = [sequenceInputLayer(numFeatures) lstmLayer(numHiddenUnits) %lstm函数 dropoutLayer(0.2)%丢弃层概率 reluLayer('name','relu')% 激励函数 RELU fullyConnectedLayer(numResponses)regressionLayer];XTrain=XTrain';YTrain=YTrain';%% 5.定义LSTM函数参数 def_options();%% 6.训练LSTM网络 net = trainNetwork(XTrain,YTrain,layers,options);%% 7.建立训练模型 net = predictAndUpdateState(net,XTrain);%% 8.仿真预测(训练集) M = numel(XTrain);for i = 1:M [net,YPred_1(:,i)] = predictAndUpdateState(net,XTrain(:,i),'ExecutionEnvironment','cpu');%endT_sim1 = sig*YPred_1 + mu;%预测结果去标准化 ,恢复原来的数量级 %% 9.仿真预测(验证集) N = numel(XTest);for i = 1:N [net,YPred_2(:,i)] = predictAndUpdateState(net,XTest(:,i),'ExecutionEnvironment','cpu');%endT_sim2 = sig*YPred_2 + mu;%预测结果去标准化 ,恢复原来的数量级 %% 10.评价指标% 均方根误差T_train=data1(1:M)';T_test=data1(M+1:end)';error1 = sqrt(sum((T_sim1 - T_train).^2) ./ M);error2 = sqrt(sum((T_sim2 - T_test ).^2) ./ N);% MAEmae1 = sum(abs(T_sim1 - T_train)) ./ M ;mae2 = sum(abs(T_sim2 - T_test )) ./ N ;disp(['训练集数据的MAE为:', num2str(mae1)])disp(['验证集数据的MAE为:', num2str(mae2)])% MAPEmaep1 = sum(abs(T_sim1 - T_train)./T_train) ./ M ;maep2 = sum(abs(T_sim2 - T_test )./T_test) ./ N ;disp(['训练集数据的MAPE为:', num2str(maep1)])disp(['验证集数据的MAPE为:', num2str(maep2)])% RMSERMSE1 = sqrt(sumsqr(T_sim1 - T_train)/M);RMSE2 = sqrt(sumsqr(T_sim2 - T_test)/N);disp(['训练集数据的RMSE为:', num2str(RMSE1)])disp(['验证集数据的RMSE为:', num2str(RMSE2)])%% 11. 绘图figuresubplot(2,1,1)plot(T_sim1,'-s','Color',[255 0 0]./255,'linewidth',1,'Markersize',5,'MarkerFaceColor',[250 0 0]./255)hold on plot(T_train,'-o','Color',[150 150 150]./255,'linewidth',0.8,'Markersize',4,'MarkerFaceColor',[150 150 150]./255)legend( 'LSTM拟合训练数据','实际分析数据','Location','NorthWest','FontName','华文宋体');title('LSTM模型预测结果及真实值','fontsize',12,'FontName','华文宋体')xlabel('样本','fontsize',12,'FontName','华文宋体');ylabel('数值','fontsize',12,'FontName','华文宋体');xlim([1 M])%-------------------------------------------------------------------------------------subplot(2,1,2)bar((T_sim1 - T_train)./T_train) legend('LSTM模型训练集相对误差','Location','NorthEast','FontName','华文宋体')title('LSTM模型训练集相对误差','fontsize',12,'FontName','华文宋体')ylabel('误差','fontsize',12,'FontName','华文宋体')xlabel('样本','fontsize',12,'FontName','华文宋体')xlim([1 M]);%-------------------------------------------------------------------------------------figuresubplot(2,1,1)plot(T_sim2,'-s','Color',[0 0 255]./255,'linewidth',1,'Markersize',5,'MarkerFaceColor',[0 0 255]./255)hold on plot(T_test,'-o','Color',[0 0 0]./255,'linewidth',0.8,'Markersize',4,'MarkerFaceColor',[0 0 0]./255)legend('LSTM预测测试数据','实际分析数据','Location','NorthWest','FontName','华文宋体');title('LSTM模型预测结果及真实值','fontsize',12,'FontName','华文宋体')xlabel('样本','fontsize',12,'FontName','华文宋体');ylabel('数值','fontsize',12,'FontName','华文宋体');xlim([1 N])%-------------------------------------------------------------------------------------subplot(2,1,2)bar((T_sim2 - T_test )./T_test) legend('LSTM模型测试集相对误差','Location','NorthEast','FontName','华文宋体')title('LSTM模型测试集相对误差','fontsize',12,'FontName','华文宋体')ylabel('误差','fontsize',12,'FontName','华文宋体')xlabel('样本','fontsize',12,'FontName','华文宋体')xlim([1 N]);%% 12.预测未来P = 7;% 预测未来数量YPred_3 = [];%预测结果清零 [T_sim3] = yuceweilai(net,XTrain,data,P,YPred_3,sig,mu)%% 13.绘图figureplot(1:size(data,1),data,'-s','Color',[255 0 0]./255,'linewidth',1,'Markersize',5,'MarkerFaceColor',[250 0 0]./255)hold on plot(size(data,1)+1:size(data,1)+P,T_sim3,'-o','Color',[150 150 150]./255,'linewidth',0.8,'Markersize',4,'MarkerFaceColor',[150 150 150]./255)legend( 'LSTM预测结果','Location','NorthWest','FontName','华文宋体');title('LSTM模型预测结果','fontsize',12,'FontName','华文宋体')xlabel('样本','fontsize',12,'FontName','华文宋体');ylabel('数值','fontsize',12,'FontName','华文宋体');
登录后可发表评论
点击登录