作者:张昊
DBA,主要负责MySQL故障处理、DMP产品支持,擅长MySQL,喜欢打球,唱歌~。
本文来源:原创投稿
*爱可生开源社区出品,原创内容未经授权不得随意使用,转载请联系小编并注明来源。
本文章比较侧重于分析流程,细节方面可能有所不足。
唠嗑环节
前段时间客户反馈有 insert 慢,查看 slow.log ,发现确实慢,不光它慢,别的也慢;(客户只关注客户的重点,运维要全面的进行分析)。
之前也遇到过类似问题,从领导那里求取真经,下面给大家简单分享下真经内容:
先整体观察某一天或这某个时间段内慢sql的记录情况,重点观察慢sql记录时间点、sql类型;如果是insert之类的sql慢,怀疑的维度大概是:磁盘io、锁、半同步复制;如果有批量慢sql的情况,重点关注select,用以排查半同步复制。开始实战
1. 宏观统计 slow.log ,经过统计发现慢 sql 呈现出批量慢的情况
记录到 slow.log 的 sql 类型比较多,有 select 、insert 、delete 、update 、commit 和 show 开头的管理类 sql 。
[root@big hao]# less slow.log |grep "# Tim"|awk -F "." '{print $1}'|termsql -0 "select COL2 time,COUNT(COL2) sql_count from tbl group by COL2"time|sql_count2022-08-30T00:05:56|632022-08-30T00:27:37|652022-08-30T00:34:58|312022-08-30T00:49:22|652022-08-30T00:56:41|612022-08-30T01:11:04|642022-08-30T01:32:50|632022-08-30T01:40:06|602022-08-30T01:54:32|592022-08-30T02:01:47|582022-08-30T02:16:16|622022-08-30T02:23:28|582022-08-30T02:37:58|582022-08-30T02:45:10|542022-08-30T02:59:40|442022-08-30T03:06:52|552022-08-30T03:21:24|552022-08-30T03:28:35|592022-08-30T03:43:08|272022-08-30T03:50:17|272022-08-30T04:04:53|582022-08-30T04:11:59|482022-08-30T04:26:34|602022-08-30T04:33:41|282022-08-30T04:48:19|242022-08-30T05:10:04|592022-08-30T05:17:07|602022-08-30T05:31:47|452022-08-30T05:38:48|612022-08-30T05:53:30|652022-08-30T06:00:30|632022-08-30T06:15:16|642022-08-30T06:22:14|652022-08-30T06:37:01|662022-08-30T06:43:55|572022-08-30T06:58:45|652022-08-30T07:05:39|652022-08-30T07:20:28|362022-08-30T07:42:10|212022-08-30T07:49:03|652022-08-30T08:03:53|352022-08-30T08:10:47|652022-08-30T08:25:37|352022-08-30T08:32:28|252022-08-30T08:47:23|512022-08-30T08:54:09|362022-08-30T09:09:07|832022-08-30T09:09:13|12022-08-30T09:15:51|742022-08-30T09:30:49|362022-08-30T09:37:35|332022-08-30T09:52:34|862022-08-30T09:59:17|212022-08-30T10:14:16|812022-08-30T10:21:01|332022-08-30T10:36:02|812022-08-30T10:42:44|722022-08-30T10:57:45|842022-08-30T11:04:27|202022-08-30T11:19:25|172022-08-30T11:41:10|202022-08-30T11:47:50|172022-08-30T12:02:52|702022-08-30T12:09:34|182022-08-30T12:24:39|652022-08-30T12:31:19|672022-08-30T12:46:20|662022-08-30T12:53:05|182022-08-30T13:08:09|672022-08-30T13:14:50|312022-08-30T13:29:56|662022-08-30T13:36:33|66[root@big hao]# less slow.log |grep "# Time" -A 6 |egrep -i "insert|delete|update|select|commit|show" |awk '{print $1}'|sed -e 's/;/ /g' |termsql -0 "select COL0 sql_stat,count(COL0) sql_count from tbl group by COL0"sql_stat|sql_countCOMMIT|59DELETE|11INSERT|321SELECT|18UPDATE|6commit|2627select|16show|17update|6282. 结合 mysql 的 error.log 中的 flush 信息进行排查
从 error.log 中看到有大量的 flush 信息输出,时间点跟 slow.log 高度重合;error.log 中的 flush 信息是表示这个时间点 mysql 在进行刷盘的时候效率比较低,进一步可以排查磁盘 io 情况。
[root@big hao]# less mysql-error.log |grep "2022-08-30T" |grep flush2022-08-30T00:05:56.685140+08:00 0 [Note] [MY-011953] [InnoDB] Page cleaner took 5301ms to flush 121 and evict 0 pages2022-08-30T00:27:37.800463+08:00 0 [Note] [MY-011953] [InnoDB] Page cleaner took 4028ms to flush 120 and evict 0 pages2022-08-30T00:49:22.874045+08:00 0 [Note] [MY-011953] [InnoDB] Page cleaner took 4992ms to flush 24 and evict 0 pages2022-08-30T01:11:04.900200+08:00 0 [Note] [MY-011953] [InnoDB] Page cleaner took 4947ms to flush 16 and evict 0 pages2022-08-30T01:32:50.117427+08:00 0 [Note] [MY-011953] [InnoDB] Page cleaner took 6136ms to flush 112 and evict 0 pages2022-08-30T01:54:32.106385+08:00 0 [Note] [MY-011953] [InnoDB] Page cleaner took 4912ms to flush 18 and evict 0 pages2022-08-30T02:16:16.060394+08:00 0 [Note] [MY-011953] [InnoDB] Page cleaner took 4870ms to flush 16 and evict 0 pages2022-08-30T02:37:58.933258+08:00 0 [Note] [MY-011953] [InnoDB] Page cleaner took 4796ms to flush 16 and evict 0 pages2022-08-30T02:59:40.755206+08:00 0 [Note] [MY-011953] [InnoDB] Page cleaner took 4741ms to flush 24 and evict 0 pages2022-08-30T03:43:08.053816+08:00 0 [Note] [MY-011953] [InnoDB] Page cleaner took 4230ms to flush 105 and evict 0 pages2022-08-30T04:04:53.504756+08:00 0 [Note] [MY-011953] [InnoDB] Page cleaner took 4381ms to flush 16 and evict 0 pages2022-08-30T06:15:16.414777+08:00 0 [Note] [MY-011953] [InnoDB] Page cleaner took 4380ms to flush 18 and evict 0 pages2022-08-30T06:37:01.679180+08:00 0 [Note] [MY-011953] [InnoDB] Page cleaner took 7198ms to flush 24 and evict 0 pages2022-08-30T06:58:45.807908+08:00 0 [Note] [MY-011953] [InnoDB] Page cleaner took 6052ms to flush 120 and evict 0 pages2022-08-30T07:20:28.078480+08:00 0 [Note] [MY-011953] [InnoDB] Page cleaner took 5189ms to flush 26 and evict 0 pages2022-08-30T07:42:10.509536+08:00 0 [Note] [MY-011953] [InnoDB] Page cleaner took 7349ms to flush 120 and evict 0 pages2022-08-30T08:03:53.622772+08:00 0 [Note] [MY-011953] [InnoDB] Page cleaner took 7035ms to flush 40 and evict 0 pages2022-08-30T08:25:37.692469+08:00 0 [Note] [MY-011953] [InnoDB] Page cleaner took 6982ms to flush 120 and evict 0 pages2022-08-30T08:47:23.035222+08:00 0 [Note] [MY-011953] [InnoDB] Page cleaner took 10264ms to flush 137 and evict 0 pages2022-08-30T09:09:07.647213+08:00 0 [Note] [MY-011953] [InnoDB] Page cleaner took 8538ms to flush 136 and evict 0 pages2022-08-30T09:30:49.287417+08:00 0 [Note] [MY-011953] [InnoDB] Page cleaner took 6570ms to flush 121 and evict 0 pages2022-08-30T09:52:34.201334+08:00 0 [Note] [MY-011953] [InnoDB] Page cleaner took 8821ms to flush 120 and evict 0 pages2022-08-30T10:14:16.708964+08:00 0 [Note] [MY-011953] [InnoDB] Page cleaner took 6419ms to flush 128 and evict 0 pages2022-08-30T10:36:02.241341+08:00 0 [Note] [MY-011953] [InnoDB] Page cleaner took 7444ms to flush 128 and evict 0 pages2022-08-30T10:57:45.240046+08:00 0 [Note] [MY-011953] [InnoDB] Page cleaner took 7926ms to flush 144 and evict 0 pages2022-08-30T11:19:25.457821+08:00 0 [Note] [MY-011953] [InnoDB] Page cleaner took 4146ms to flush 11 and evict 0 pages2022-08-30T11:41:10.135784+08:00 0 [Note] [MY-011953] [InnoDB] Page cleaner took 5599ms to flush 9 and evict 0 pages2022-08-30T12:02:52.696129+08:00 0 [Note] [MY-011953] [InnoDB] Page cleaner took 6495ms to flush 10 and evict 0 pages2022-08-30T12:24:39.010150+08:00 0 [Note] [MY-011953] [InnoDB] Page cleaner took 8246ms to flush 10 and evict 0 pages2022-08-30T12:46:20.517719+08:00 0 [Note] [MY-011953] [InnoDB] Page cleaner took 4433ms to flush 11 and evict 0 pages2022-08-30T13:08:09.203494+08:00 0 [Note] [MY-011953] [InnoDB] Page cleaner took 10607ms to flush 123 and evict 0 pages2022-08-30T13:29:56.427760+08:00 0 [Note] [MY-011953] [InnoDB] Page cleaner took 11156ms to flush 24 and evict 0 pages2022-08-30T13:51:44.961560+08:00 0 [Note] [MY-011953] [InnoDB] Page cleaner took 12464ms to flush 19 and evict 0 pages2022-08-30T14:13:30.720673+08:00 0 [Note] [MY-011953] [InnoDB] Page cleaner took 9677ms to flush 17 and evict 0 pages2022-08-30T14:35:16.044102+08:00 0 [Note] [MY-011953] [InnoDB] Page cleaner took 11250ms to flush 185 and evict 0 pages2022-08-30T14:57:01.166176+08:00 0 [Note] [MY-011953] [InnoDB] Page cleaner took 10031ms to flush 113 and evict 0 pages2022-08-30T15:18:46.788154+08:00 0 [Note] [MY-011953] [InnoDB] Page cleaner took 11545ms to flush 104 and evict 0 pages2022-08-30T15:40:31.365101+08:00 0 [Note] [MY-011953] [InnoDB] Page cleaner took 9504ms to flush 10 and evict 0 pages2022-08-30T16:02:18.469655+08:00 0 [Note] [MY-011953] [InnoDB] Page cleaner took 10029ms to flush 9 and evict 0 pages2022-08-30T16:24:00.665416+08:00 0 [Note] [MY-011953] [InnoDB] Page cleaner took 7106ms to flush 13 and evict 0 pages2022-08-30T16:45:48.000669+08:00 0 [Note] [MY-011953] [InnoDB] Page cleaner took 10248ms to flush 10 and evict 0 pages2022-08-30T17:07:32.486231+08:00 0 [Note] [MY-011953] [InnoDB] Page cleaner took 10406ms to flush 24 and evict 0 pages2022-08-30T17:29:19.041210+08:00 0 [Note] [MY-011953] [InnoDB] Page cleaner took 10477ms to flush 24 and evict 0 pages2022-08-30T17:51:06.170389+08:00 0 [Note] [MY-011953] [InnoDB] Page cleaner took 12039ms to flush 104 and evict 0 pages2022-08-30T18:12:52.601286+08:00 0 [Note] [MY-011953] [InnoDB] Page cleaner took 10351ms to flush 16 and evict 0 pages2022-08-30T18:34:40.850308+08:00 0 [Note] [MY-011953] [InnoDB] Page cleaner took 12176ms to flush 106 and evict 0 pages2022-08-30T18:56:27.521509+08:00 0 [Note] [MY-011953] [InnoDB] Page cleaner took 8591ms to flush 25 and evict 0 pages2022-08-30T19:18:12.374391+08:00 0 [Note] [MY-011953] [InnoDB] Page cleaner took 9778ms to flush 17 and evict 0 pages2022-08-30T19:39:59.425549+08:00 0 [Note] [MY-011953] [InnoDB] Page cleaner took 10982ms to flush 17 and evict 0 pages2022-08-30T20:01:43.432897+08:00 0 [Note] [MY-011953] [InnoDB] Page cleaner took 8925ms to flush 16 and evict 0 pages2022-08-30T20:23:31.657359+08:00 0 [Note] [MY-011953] [InnoDB] Page cleaner took 12138ms to flush 18 and evict 0 pages2022-08-30T20:45:16.677588+08:00 0 [Note] [MY-011953] [InnoDB] Page cleaner took 9932ms to flush 27 and evict 0 pages2022-08-30T21:07:03.512955+08:00 0 [Note] [MY-011953] [InnoDB] Page cleaner took 10763ms to flush 25 and evict 0 pages2022-08-30T21:28:48.726420+08:00 0 [Note] [MY-011953] [InnoDB] Page cleaner took 9139ms to flush 18 and evict 0 pages2022-08-30T21:50:35.496745+08:00 0 [Note] [MY-011953] [InnoDB] Page cleaner took 10696ms to flush 16 and evict 0 pages2022-08-30T22:12:20.785958+08:00 0 [Note] [MY-011953] [InnoDB] Page cleaner took 9216ms to flush 16 and evict 0 pages2022-08-30T22:34:05.561838+08:00 0 [Note] [MY-011953] [InnoDB] Page cleaner took 8703ms to flush 18 and evict 0 pages2022-08-30T22:55:50.686158+08:00 0 [Note] [MY-011953] [InnoDB] Page cleaner took 9042ms to flush 16 and evict 0 pages2022-08-30T23:17:36.178498+08:00 0 [Note] [MY-011953] [InnoDB] Page cleaner took 10405ms to flush 18 and evict 0 pages2022-08-30T23:39:22.707252+08:00 0 [Note] [MY-011953] [InnoDB] Page cleaner took 10440ms to flush 16 and evict 0 pages3. 配置磁盘监控脚本,分析监控数据
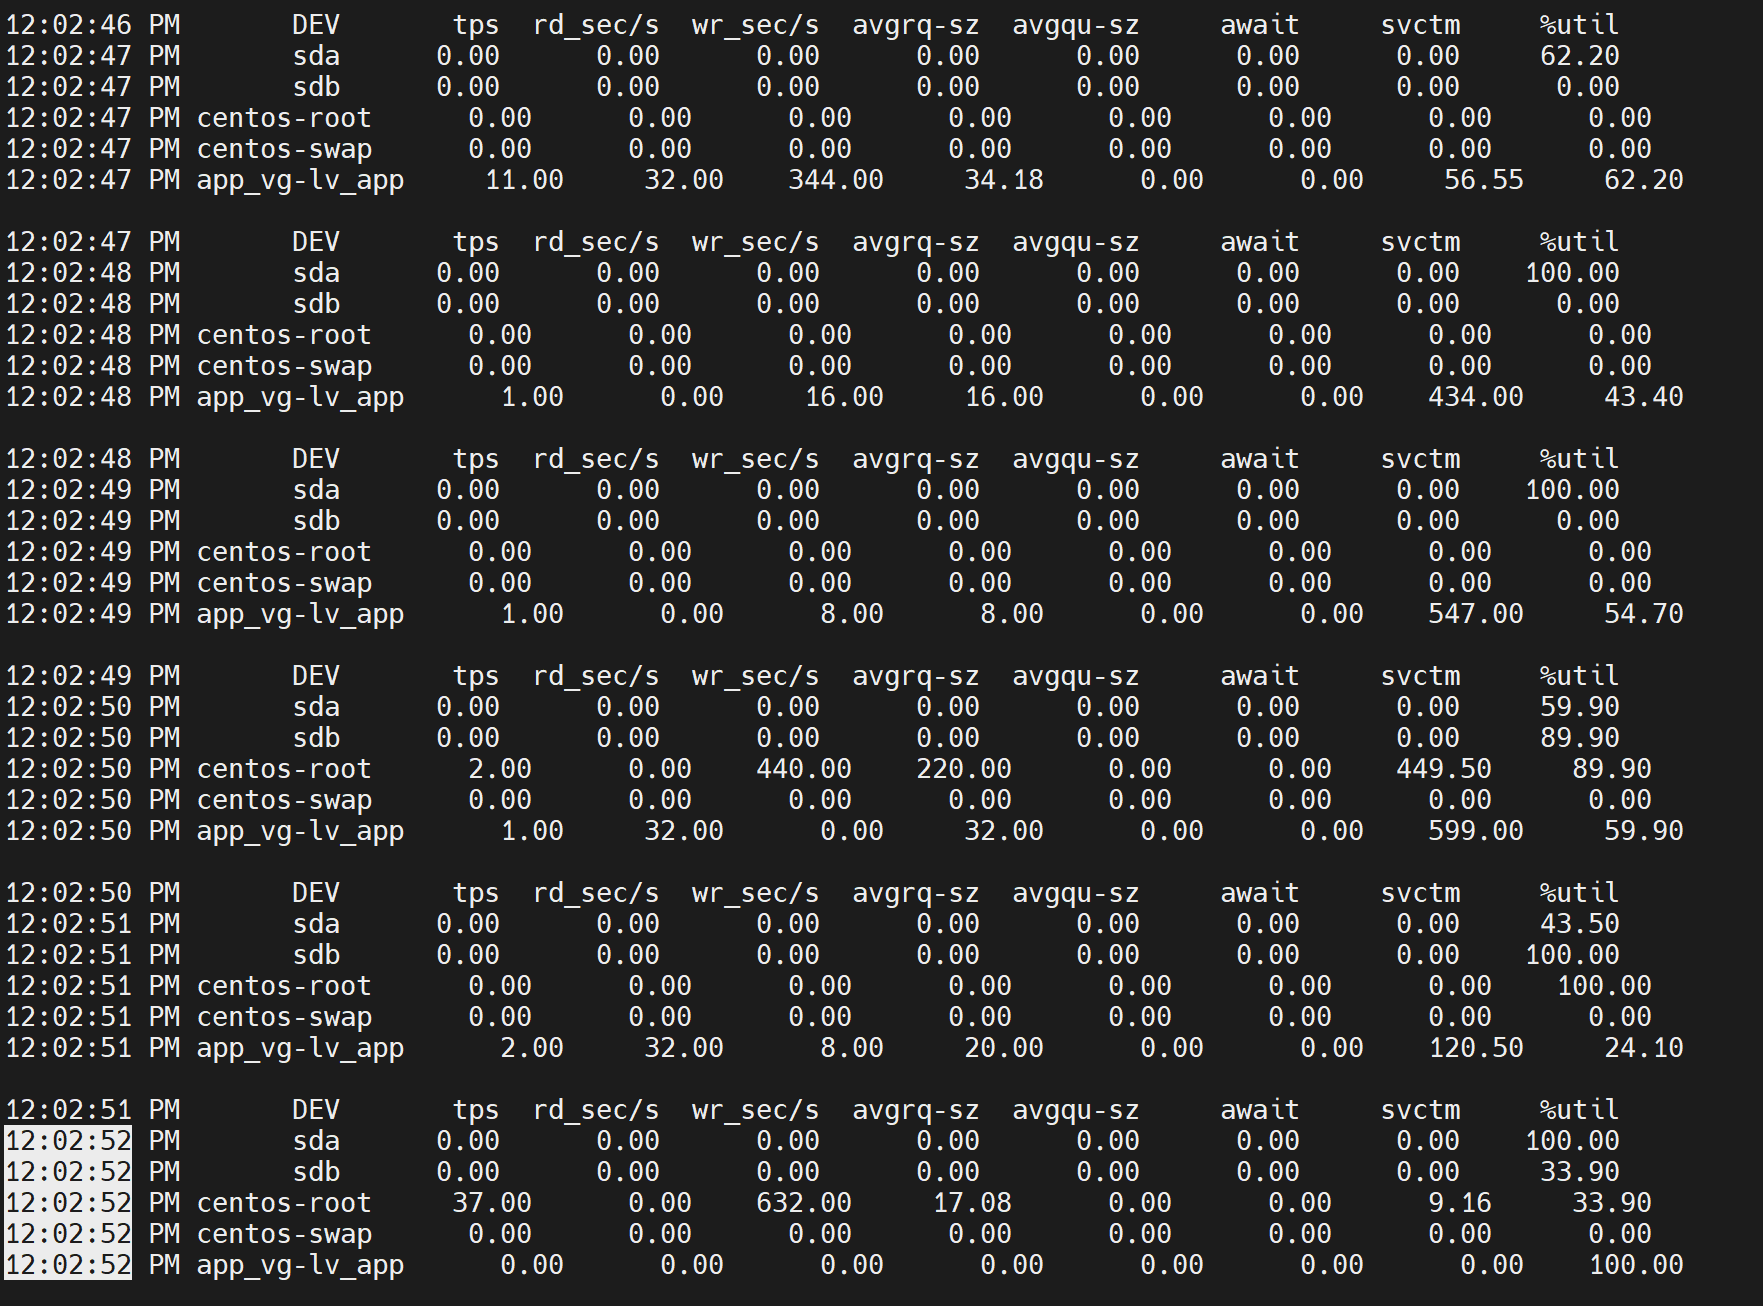
分析部分时间点发现磁盘 io 确实存在异常情况,跟 mysql-error.log 中 flush 的时间点完全重合。
//磁盘io监控脚本#!/bin/bashwhile sleep 1;doecho "########`date '+%F %H:%M:%S'`" >> /app/monitor/diskmoni$(date "+%Y%m%d").logsar -d -p 1 10 >> /app/monitor/diskmoni$(date "+%Y%m%d").logdone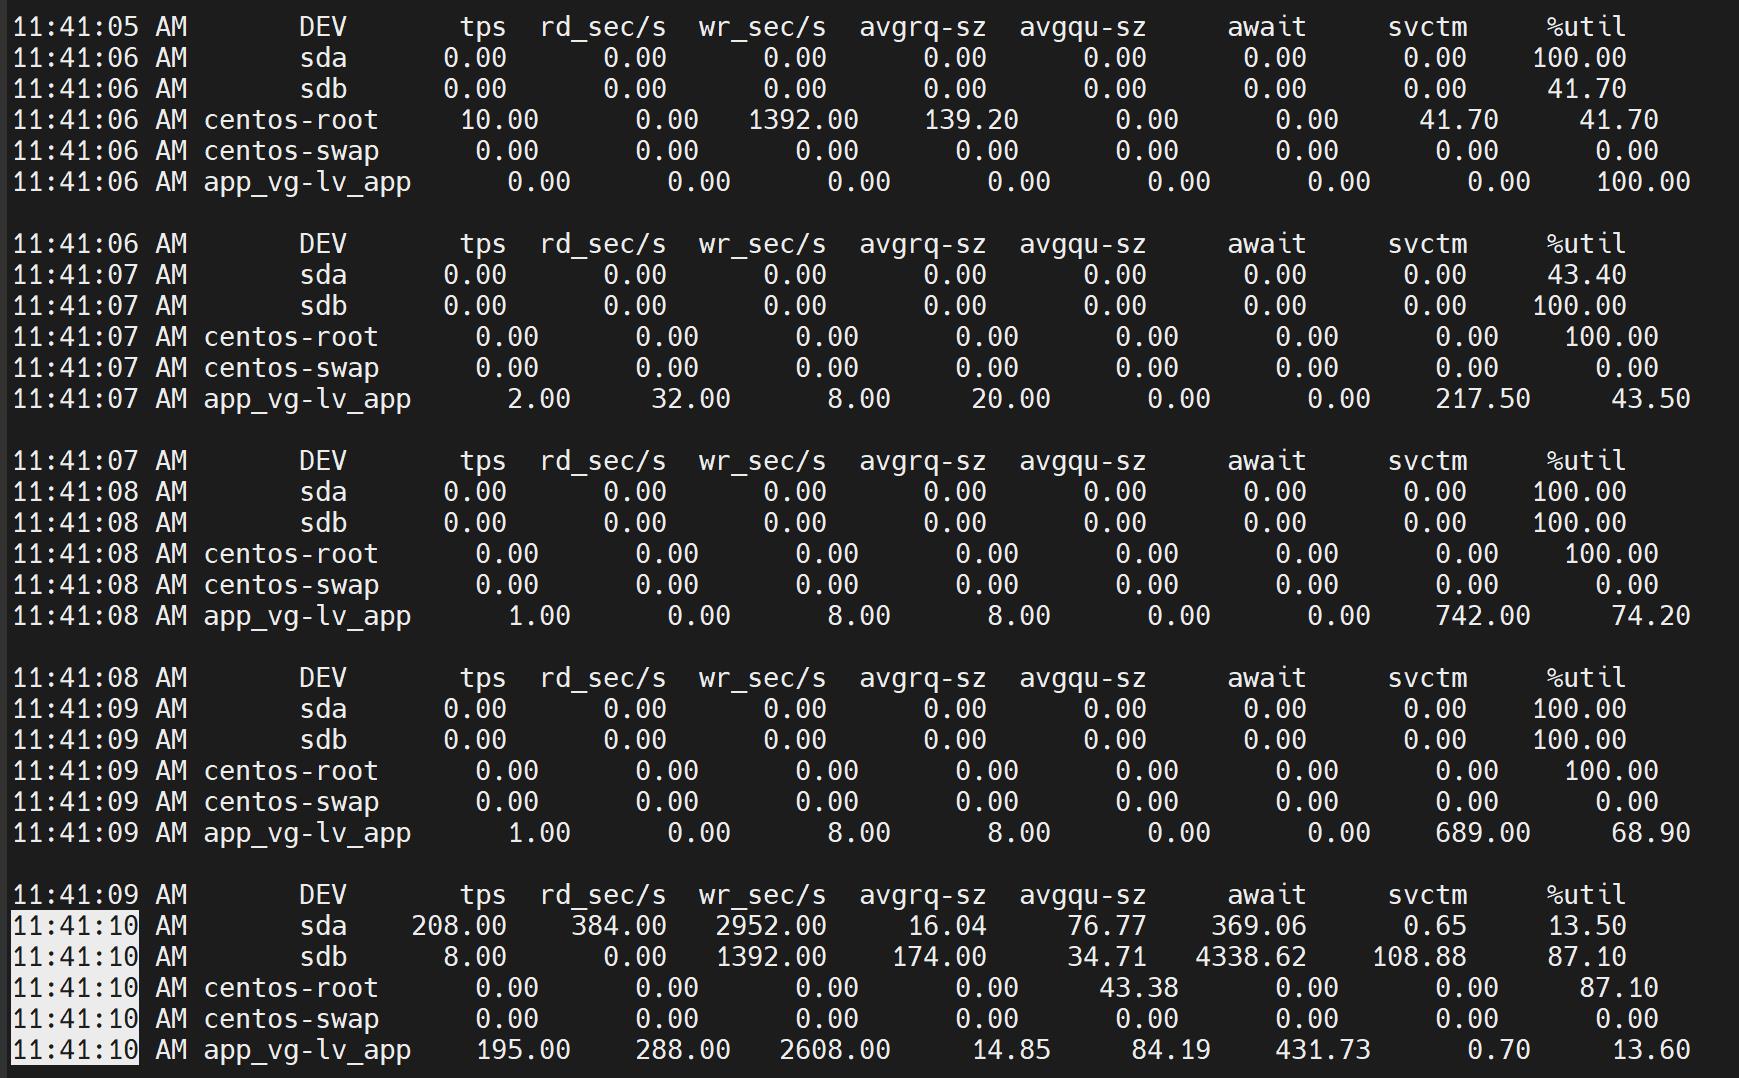
4. 其他时间点的慢sql分析
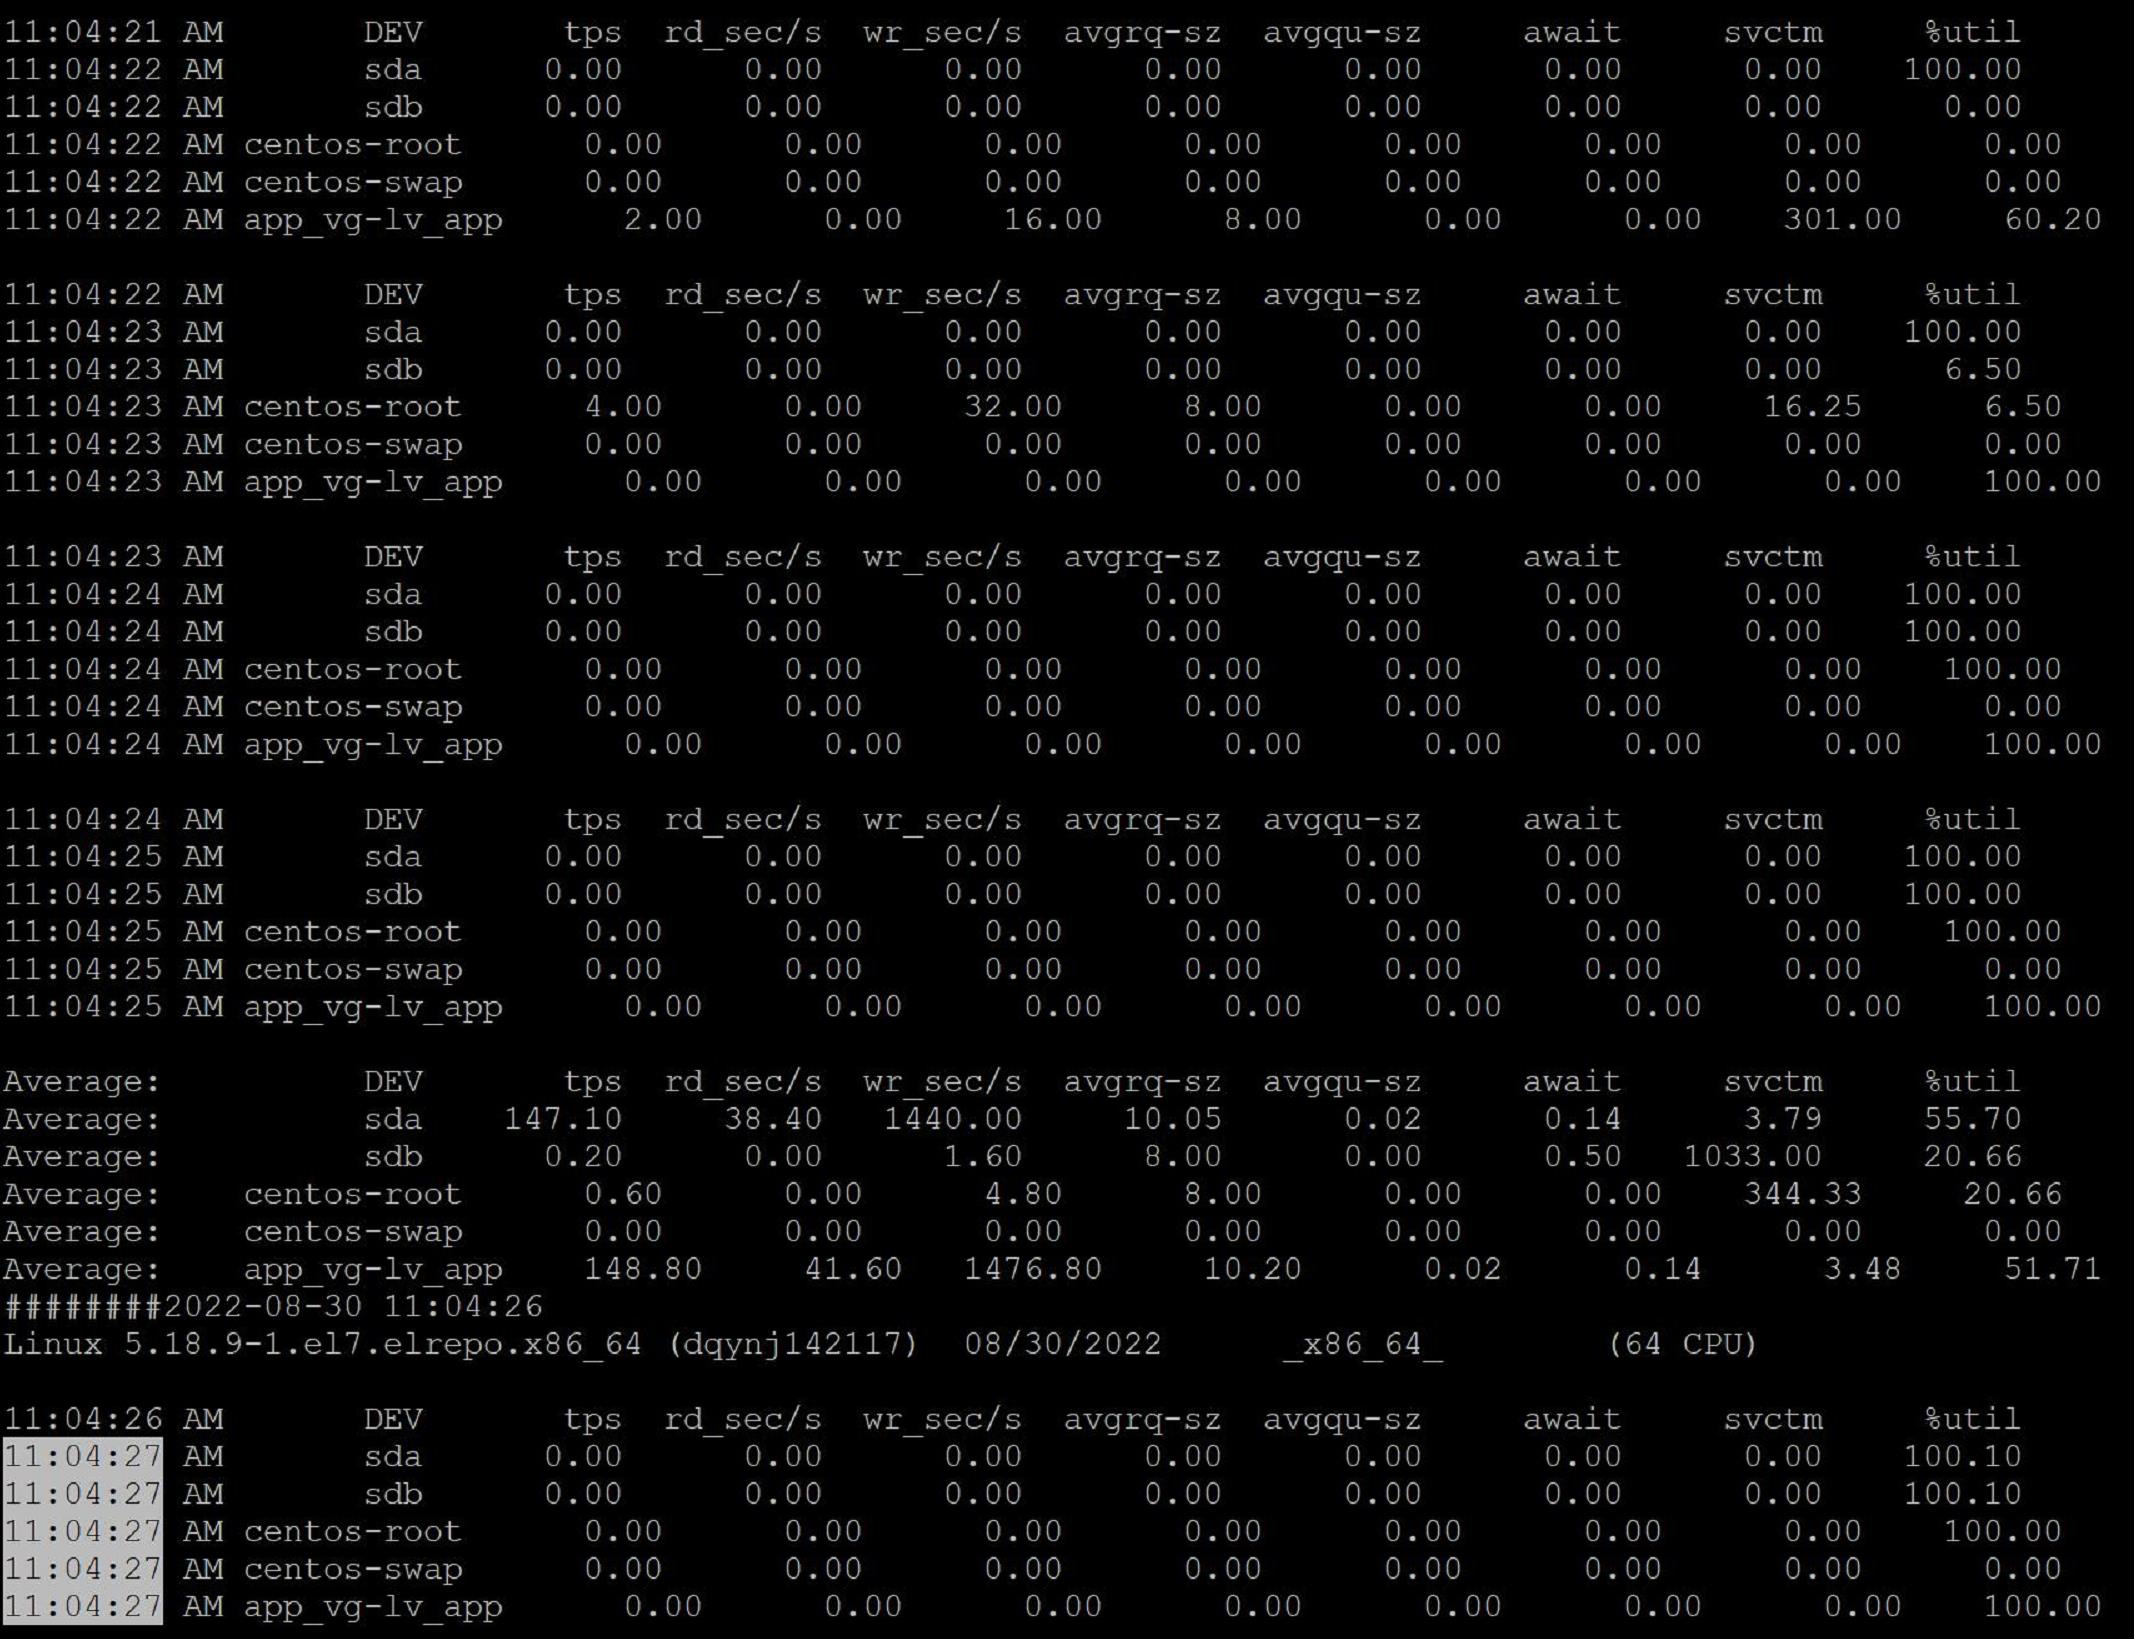
在 slow.log 中还有一些时间点也出现了大量的慢 sql ,这个时间点主库的磁盘 io 是正常的,例如 slow.log 中的“2022-08-30T11:04:27”,分析这个时间点的慢 sql ,首先没发现 select 语句,其次锁等待时间基本可以忽略,那么此时要考虑半同步复制机制的影响。
[root@big hao]# less slow.log |grep "2022-08-30T11:04:27" -A 6 |egrep -i "2022-08-30T11:04:27|insert|delete|update|select|commit|show" |sed -e 's/# Time:/ /g'|awk '{print $1,$2}'|awk '{print $1}'|awk -F '.' '{print $1}'|termsql -0 "select COL0 ,count(COL0) count from tbl group by COL0"COL0|count2022-08-30T11:04:27|20COMMIT;|1DELETE|1INSERT|5update|13 [root@big hao]# less slow.log |grep "2022-08-30T11:04:27" -A 3 |grep "Lock_time"|awk '{print $4,$5,$8,$9}'Lock_time: 0.000105 Rows_examined: 1Lock_time: 0.000130 Rows_examined: 1Lock_time: 0.000113 Rows_examined: 1Lock_time: 0.000000 Rows_examined: 0Lock_time: 0.000105 Rows_examined: 0Lock_time: 0.000469 Rows_examined: 0Lock_time: 0.000109 Rows_examined: 1Lock_time: 0.000110 Rows_examined: 1Lock_time: 0.000114 Rows_examined: 1Lock_time: 0.000112 Rows_examined: 2Lock_time: 0.000114 Rows_examined: 2Lock_time: 0.000107 Rows_examined: 0Lock_time: 0.000107 Rows_examined: 1Lock_time: 0.000116 Rows_examined: 1Lock_time: 0.000137 Rows_examined: 1Lock_time: 0.000112 Rows_examined: 1Lock_time: 0.000097 Rows_examined: 0Lock_time: 0.000143 Rows_examined: 1Lock_time: 0.000098 Rows_examined: 3Lock_time: 0.000611 Rows_examined: 0开启主库半同步复制的 strace 日志,开启步骤如下,开启之后会将半同步信息记录到 mysql-error.log 中,开启之后首先会占用大量磁盘空间,其次是占用磁盘 io ,所以生产环境最好不要长时间开启。
//开启半同步strace日志mysql> show variables like 'rpl_semi_sync_slave_trace_level';+---------------------------------+-------+| Variable_name | Value |+---------------------------------+-------+| rpl_semi_sync_slave_trace_level | 32 |+---------------------------------+-------+1 row in set (0.01 sec) mysql> set global rpl_semi_sync_slave_trace_level = 16;Query OK, 0 rows affected (0.00 sec) mysql> show variables like 'rpl_semi_sync_slave_trace_level';+---------------------------------+-------+| Variable_name | Value |+---------------------------------+-------+| rpl_semi_sync_slave_trace_level | 16 |+---------------------------------+-------+1 row in set (0.04 sec) //关闭半同步strace日志 mysql> set global rpl_semi_sync_slave_trace_level = 32;Query OK, 0 rows affected (0.00 sec) mysql> show variables like 'rpl_semi_sync_slave_trace_level';+---------------------------------+-------+| Variable_name | Value |+---------------------------------+-------+| rpl_semi_sync_slave_trace_level | 32 |+---------------------------------+-------+1 row in set (0.01 sec)查看半同步日志之前先分享两个日志标识:
ReplSemiSyncMaster::updateSyncHeader:主库更新packet头部标记位为Sync,紧接着就会发送binlog给从库;
ReplSemiSyncMaster::reportReplyPacket:主库接受到从库返回的ack信息,附带有log_file、log_pos、从库的server_id。
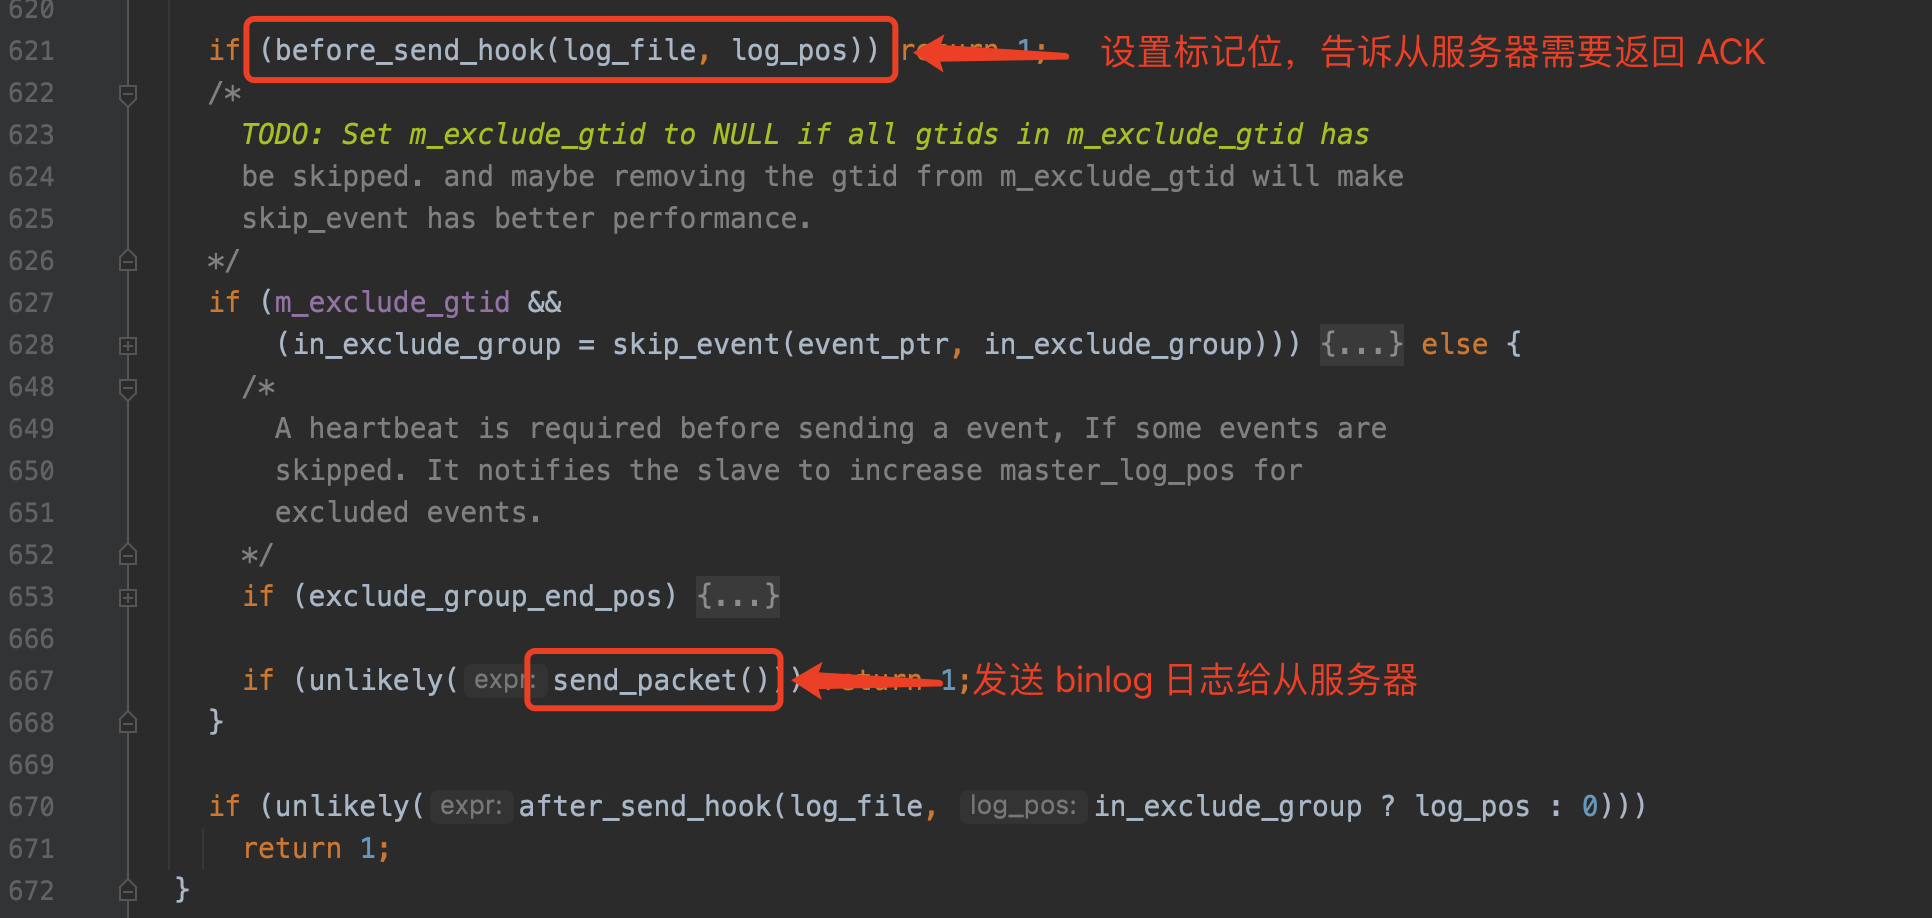
这两个标识之间的时间差可以理解为半同步复制机制对业务性能的主要影响,可以看到下面的日志中主库发送给从库 binlog 6s 之后才收到从库的ack信息;首先网络情况会影响半同步复制,其次从库的 io 能力也会影响半同步复制,因为当主库发送 binlog 给从库之后,从库要先将 binlog 写入自己的 relaylog 中然后再返回给主库 ack 。
//提取出的半同步部分日志2022-08-30T11:04:21.919587+08:00 23176 [Note] [MY-011133] [Repl] ActiveTranx:insert_tranx_node: insert (mysql-bin.003497, 9432086) in entry(4191).2022-08-30T11:04:21.920085+08:00 655 [Note] [MY-011134] [Repl] ActiveTranx::is_tranx_end_pos: probe (mysql-bin.003497, 9432086) in entry(4191).2022-08-30T11:04:21.920102+08:00 655 [Note] [MY-011158] [Repl] ReplSemiSyncMaster::updateSyncHeader: server(11111), (mysql-bin.003497, 9432086) sync(1), repl(1).2022-08-30T11:04:27.599408+08:00 0 [Note] [MY-011140] [Repl] ReplSemiSyncMaster::reportReplyPacket: Got reply(mysql-bin.003497, 9432086) from server 11111.2022-08-30T11:04:27.599423+08:00 0 [Note] [MY-011146] [Repl] ReplSemiSyncMaster::reportReplyBinlog: Got reply at (mysql-bin.003497, 9432086).查看这段时间主库跟从库的网络监控发现网络没有太大问题。
[root@big hao]# grep -A 20 "2022-08-30 11:04:" ping20220830.log########2022-08-30 11:04:04PING *.*.*.* (*.*.*.*) 56(84) bytes of data.64 bytes from *.*.*.*: icmp_seq=1 ttl=64 time=0.050 ms64 bytes from *.*.*.*: icmp_seq=2 ttl=64 time=0.061 ms64 bytes from *.*.*.*: icmp_seq=3 ttl=64 time=0.044 ms64 bytes from *.*.*.*: icmp_seq=4 ttl=64 time=0.046 ms64 bytes from *.*.*.*: icmp_seq=5 ttl=64 time=0.057 ms64 bytes from *.*.*.*: icmp_seq=6 ttl=64 time=0.062 ms64 bytes from *.*.*.*: icmp_seq=7 ttl=64 time=0.067 ms64 bytes from *.*.*.*: icmp_seq=8 ttl=64 time=0.063 ms64 bytes from *.*.*.*: icmp_seq=9 ttl=64 time=0.057 ms64 bytes from *.*.*.*: icmp_seq=10 ttl=64 time=0.067 ms --- *.*.*.* ping statistics ---10 packets transmitted, 10 received, 0% packet loss, time 9229msrtt min/avg/max/mdev = 0.044/0.057/0.067/0.010 ms########2022-08-30 11:04:14PING *.*.*.* (*.*.*.*) 56(84) bytes of data.64 bytes from *.*.*.*: icmp_seq=1 ttl=64 time=0.057 ms64 bytes from *.*.*.*: icmp_seq=2 ttl=64 time=0.051 ms64 bytes from *.*.*.*: icmp_seq=3 ttl=64 time=0.059 ms64 bytes from *.*.*.*: icmp_seq=4 ttl=64 time=0.063 ms64 bytes from *.*.*.*: icmp_seq=5 ttl=64 time=0.070 ms64 bytes from *.*.*.*: icmp_seq=6 ttl=64 time=0.062 ms64 bytes from *.*.*.*: icmp_seq=7 ttl=64 time=0.069 ms64 bytes from *.*.*.*: icmp_seq=8 ttl=64 time=0.050 ms64 bytes from *.*.*.*: icmp_seq=9 ttl=64 time=0.049 ms64 bytes from *.*.*.*: icmp_seq=10 ttl=64 time=0.065 ms --- *.*.*.* ping statistics ---10 packets transmitted, 10 received, 0% packet loss, time 9230msrtt min/avg/max/mdev = 0.049/0.059/0.070/0.010 ms########2022-08-30 11:04:25PING *.*.*.* (*.*.*.*) 56(84) bytes of data.64 bytes from *.*.*.*: icmp_seq=1 ttl=64 time=0.057 ms64 bytes from *.*.*.*: icmp_seq=2 ttl=64 time=0.053 ms64 bytes from *.*.*.*: icmp_seq=3 ttl=64 time=0.045 ms64 bytes from *.*.*.*: icmp_seq=4 ttl=64 time=0.057 ms64 bytes from *.*.*.*: icmp_seq=5 ttl=64 time=0.063 ms64 bytes from *.*.*.*: icmp_seq=6 ttl=64 time=0.055 ms64 bytes from *.*.*.*: icmp_seq=7 ttl=64 time=0.061 ms64 bytes from *.*.*.*: icmp_seq=8 ttl=64 time=0.069 ms64 bytes from *.*.*.*: icmp_seq=9 ttl=64 time=0.062 ms64 bytes from *.*.*.*: icmp_seq=10 ttl=64 time=0.067 ms查看从库磁盘 io 监控发现从库磁盘出现 io 异常,也就是说 slow.log 中其他时间点的慢 sql 是跟半同步复制有关系,但原因还是因为磁盘的 io 异常所导致。
总结
慢日志中被大量记录的sql是commit,其次是update和insert,这类sq相对比较吃io;如果一批sql中带有简单的select语句,大概率跟半同步复制关系不大;慢日志中记录了88show master status语句,大家可以猜一猜它为什么也会慢呢?小贴士
大多数监控平台对于磁盘io监控数据采集的频率为15s/次,此时查看监控平台很难看到磁盘的异常情况,所以本次通过手工部署监控脚本来检测磁盘io情况