若该文为原创文章,转载请注明原文出处
本文章博客地址:https://hpzwl.blog.csdn.net/article/details/125731144
红胖子(红模仿)的博文大全:开发技术集合(包含Qt实用技术、树莓派、三维、OpenCV、OpenGL、ffmpeg、OSG、单片机、软硬结合等等)持续更新中…(点击传送门)
Qt开发专栏:三方库开发技术
上一篇:《Qt+ECharts开发笔记(二):Qt窗口动态调整大小,使ECharts跟随Qt窗口大小变换而变换大小》
下一篇:敬请期待…
前言
上一篇成功是EChart随着Qt窗口变化而变化,本篇将开始正式介绍柱状图介绍、基础使用,并将其封装一层Qt。
本篇的demo实现了隐藏js代码的方式,实现了一个条形图的基本交互方式,即Qt调用js脚本操作html。
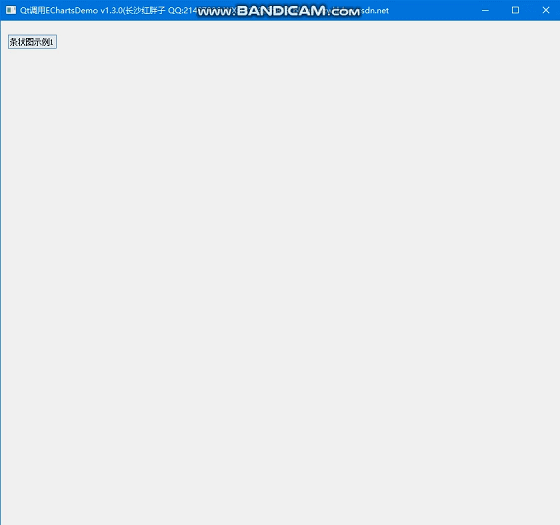
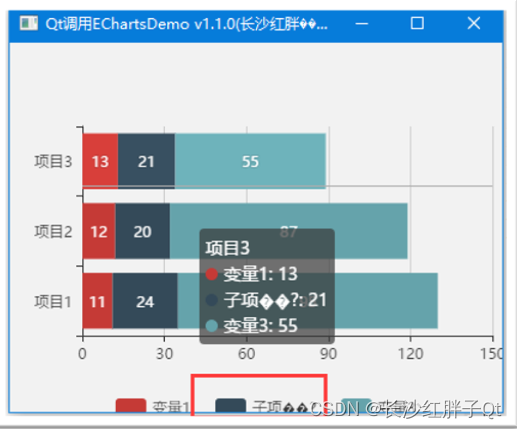
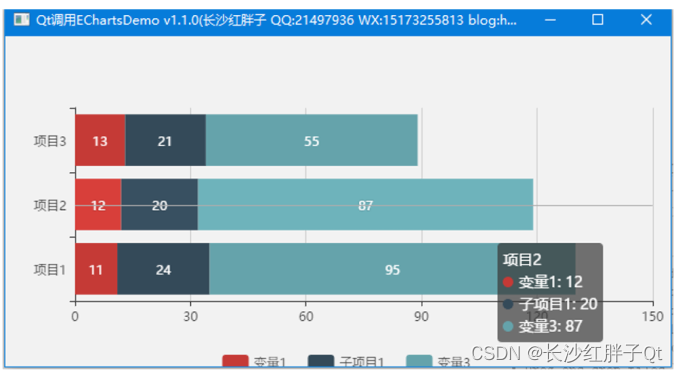
Demo演示
ECharts调试工具
ECharts提供的纯JS代码编辑开发调试工具,可编辑js,并且查看运行效果:
https://echarts.apache.org/examples/zh/editor.html
开发过程中对于属性的查询和调试ECharts也提供了配置帮助。
官方配置手册:https://echarts.apache.org/zh/option.html
目标
随便找一个预期目标:
ECharts接口静态方式
使用EChart调试工具开发,先调试出基础框架。
这里贴出的全部代码:
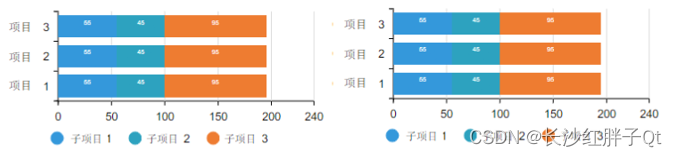
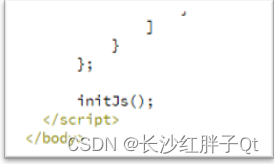
<!DOCTYPE html><html> <head> <meta charset="utf-8" /> <title>ECharts</title> <!-- 引入刚刚下载的 ECharts 文件 --> <!--<script src="echarts.js"></script>--> <script src="./echarts.js"></script> <!--<script src="D:/qtProject/echartsDemo/echartsDemo/modules/barEChartWidget/html/echarts.js"></script>--> <!--<script src="echarts.min.js"></script>--> <!--<script src="./echarts.min.js"></script>--> <!--<script src="./html/echarts.min.js"></script>--> <!--<script src="D:/qtProject/echartsDemo/echartsDemo/modules/barEChartWidget/html/echarts.min.js"></script>--> </head> <body> <!--设置body跟随查u哪个口,main填充body--> <style> #main, html, body{ width: 100%; height: 100%; overflow: hidden; } #main { width: 100%; height: 100%; } </style> <div id="main"></div> <script type="text/javascript"> // 基于准备好的dom,初始化echarts实例 var myChart = echarts.init(document.getElementById('main')); // 窗口高度变化设置 window.onresize = function() { myChart.resize(); }; // 指定图表的配置项和数据 var option = { title: { text: 'ECharts 入门示例' }, tooltip: {}, legend: { data: ['销量'] }, xAxis: { data: ['衬衫', '羊毛衫', '雪纺衫', '裤子', '高跟鞋', '袜子'] }, yAxis: {}, series: [ { name: '销量', type: 'bar', data: [5, 20, 36, 10, 10, 20] } ] }; // 使用刚指定的配置项和数据显示图表。 myChart.setOption(option); function initJs() { var myChart = echarts.init(document.getElementById('main')); var option; option = { tooltip: { trigger: 'axis' }, grid: { left: '3%', right: '4%', bottom: '50', containLabel: true }, legend: { orient: 'horizontal', x: 'center', y: 'bottom', itemGap: 100 }, xAxis: { type: 'value' }, yAxis: { type: 'category', data: ['项目1', '项目2', '项目3'] }, series: [ { name: '变量1', type: 'bar', stack: 'totla', label: { show: true }, data: [11, 12, 13] }, { name: '子项目1', type: 'bar', stack: 'totla', label: { show: true }, data: [24, 20, 21] }, { name: '变量3', type: 'bar', stack: 'totla', label: { show: true }, data: [95, 87, 55] } ] }; }; initJs(); </script> </body></html>ECharts接口动态方式
动态方式,最初目的是为了动态实现数据的js操作,在开发过程中发现动态方式还能隐藏echarts代码,使echarts代码不被抓取,最后决定全部改为动态加载方式。
步骤一:修改html
<!DOCTYPE html><html> <head> <meta charset="utf-8" /> <title>ECharts</title> <script src="./echarts.js"></script> </head> <body> <style> #main, html, body{ width: 100%; height: 100%; overflow: hidden; } #main { width: 95%; height: 95%; } </style> <div id="main"></div> <script type="text/javascript"> var myChart = echarts.init(document.getElementById('main')); window.onresize = function() { myChart.resize(); }; </script> </body></html>步骤二:初始化
新增了loadFinished信号槽关联。
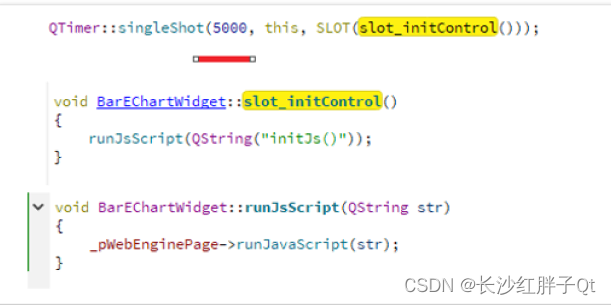
void BarEChartWidget::initControl(){ _pWebEngineView = new QWebEngineView(this); _pWebEnginePage = new QWebEnginePage(this); _pWebChannel = new QWebChannel(this); QString filePath;#if 1 filePath = QString("%1/%2").arg(_htmlDir).arg(_indexFileName);#else filePath = "qrc:/barEChartWidget/html/barEChartWidget.html";#endif LOG << "file exist:" << QFile::exists(filePath) << filePath;#if 0 // 打印html文件内容 QFile file(_indexFilePath); file.open(QIODevice::ReadOnly); LOG << QString(file.readAll()); file.close();#endif connect(_pWebEnginePage, SIGNAL(loadFinished(bool)), this, SLOT(slot_loadFinished(bool))); _pWebEnginePage->load(QUrl(filePath)); _pWebEnginePage->setWebChannel(_pWebChannel); _pWebEngineView->setPage(_pWebEnginePage); // 背景透明// _pWebEngineView->setStyleSheet("background-color: transparent"); _pWebEnginePage->setBackgroundColor(Qt::transparent);}步骤三:加载完成页面后进行初始化
void BarEChartWidget::slot_loadFinished(bool result){ if(result) { initJs(); }}void BarEChartWidget::initJs(){ _initJsStr = QSTRING( "var option;" "option = {" " tooltip: {" " trigger: 'axis'" " }," " grid: {" " left: '10'," " right: '10'," " top: '10'," " bottom: 30," " containLabel: true" " }," " legend: {" " orient: 'horizontal'," " x: 'center'," " y: 'bottom'," " itemGap: 20" " }," " xAxis: {" " type: 'value'" " }," " yAxis: {" " type: 'category'," " data: ['项目1', '项目2', '项目3']" " }," " series: [" " {" " name: '变量1'," " type: 'bar'," " stack: 'totla'," " label: {" " show: true" " }," " data: [11, 12, 13]" " }," " {" " name: '变量2'," " type: 'bar'," " stack: 'totla'," " label: {" " show: true" " }," " data: [24, 20, 21]" " }," " {" " name: '变量3'," " type: 'bar'," " stack: 'totla'," " label: {" " show: true" " }," " data: [95, 87, 55]" " }" " ]" "};" "myChart.setOption(option);"); runJsScript(_initJsStr);}void BarEChartWidget::runJsScript(QString str){ if(_pWebEnginePage) { _pWebEnginePage->runJavaScript(str); }}步骤四:动态执行js操作
重置
void BarEChartWidget::on_pushButton_reset_clicked(){ initJs();}刷新
void BarEChartWidget::on_pushButton_flush_clicked(){ QString jsStr = "var empty = {};" "myChart.setOption(empty, true);" "myChart.setOption(option, true);"; runJsScript(jsStr);}清空
void BarEChartWidget::on_pushButton_clear_clicked(){ QString jsStr = "option.series[0].data = [];" "option.series[1].data = [];" "option.series[2].data = [];" "myChart.setOption(option, true);"; runJsScript(jsStr);}随机生成(使用js代码)
void BarEChartWidget::on_pushButton_createRandom_clicked(){ QString jsStr = "var min = 0;" "var max = 100;" "for(var i = 0; i < option.series.length; i++)" "{" " for(var j = 0; j < option.yAxis.data.length; j++)" " {" " option.series[i].data[j] = Math.floor(Math.random() * (max - min)) + min;" " }" "}" "myChart.setOption(option, true);"; runJsScript(jsStr);}后续用会将数据进行Qt的一份缓存数据,由Qt的数据去生成ecahrts的js脚本。
Demo
html文件
<!DOCTYPE html><html> <head> <meta charset="utf-8" /> <title>ECharts</title> <script src="./echarts.js"></script> </head> <body> <style> #main, html, body{ width: 100%; height: 100%; overflow: hidden; } #main { width: 95%; height: 95%; } </style> <div id="main"></div> <script type="text/javascript"> var myChart = echarts.init(document.getElementById('main')); window.onresize = function() { myChart.resize(); }; </script> </body></html> 在代码中使用js初始化echarts:
BarECartWidget.h
#ifndef BARECHARTWIDGET_H#define BARECHARTWIDGET_H#include <QWidget>#include <QWebEngineView>#include <QWebEnginePage>#include <QWebChannel>namespace Ui {class BarEChartWidget;}class BarEChartWidget : public QWidget{ Q_OBJECTpublic: explicit BarEChartWidget(QWidget *parent = 0); ~BarEChartWidget();protected: void initControl();protected slots: void slot_loadFinished(bool result);protected: void initJs();protected: void runJsScript(QString str);protected: void resizeEvent(QResizeEvent *event);private slots: void on_pushButton_clear_clicked(); void on_pushButton_flush_clicked(); void on_pushButton_createRandom_clicked(); void on_pushButton_reset_clicked();private: Ui::BarEChartWidget *ui;private: QWebEngineView *_pWebEngineView; // 浏览器窗口 QWebEnginePage *_pWebEnginePage; // 浏览器页面 QWebChannel *_pWebChannel; // 浏览器js交互 QString _htmlDir; // html文件夹路径 QString _indexFileName; // html文件 QString _initJsStr; // 第一次初始化的表格};#endif // BARECHARTWIDGET_HBarEChartWidget.cpp
#include "BarEChartWidget.h"#include "ui_BarEChartWidget.h"#include <QFile>#include <QMessageBox>#include <QTimer>// QtCreator在msvc下设置编码也或有一些乱码,直接一刀切,避免繁琐的设置//#define MSVC#ifdef MSVC#define QSTRING(s) QString::fromLocal8Bit(s)#else#define QSTRING(s) QString(s)#endif#include <QDebug>#include <QDateTime>//#define LOG qDebug()<<__FILE__<<__LINE__//#define LOG qDebug()<<__FILE__<<__LINE__<<__FUNCTION__//#define LOG qDebug()<<__FILE__<<__LINE__<<QThread()::currentThread()//#define LOG qDebug()<<__FILE__<<__LINE__<<QDateTime::currentDateTime().toString("yyyy-MM-dd")#define LOG qDebug()<<__FILE__<<__LINE__<<QDateTime::currentDateTime().toString("yyyy-MM-dd hh:mm:ss:zzz")BarEChartWidget::BarEChartWidget(QWidget *parent) : QWidget(parent), ui(new Ui::BarEChartWidget), _pWebEngineView(0), _pWebEnginePage(0), _pWebChannel(0), _htmlDir("D:/qtProject/echartsDemo/echartsDemo/modules/barEChartWidget/html"), // 使用了绝对路径,引到html文件夹 _indexFileName("barEChartWidget.html"){ ui->setupUi(this); QString version = "v1.0.0"; setWindowTitle(QString("基于Qt的ECharts条状图Demo %1(长沙红胖子 QQ:21497936 WX:15173255813 blog:hpzwl.blog.csdn.net").arg(version)); // 设置无边框,以及背景透明 // 背景透明,在界面构架时,若为本窗口为其他窗口提升为本窗口时, // 则再qss会在主窗口第一级添加frame_all,防止其他窗口提升本窗口而冲掉qss设置// setWindowFlag(Qt::FramelessWindowHint);// setAttribute(Qt::WA_TranslucentBackground, true);#if 0 // 这是方法一:让滚动条不出来(通过大小),还有一个方法是在html设置body的overflow: hidden// resize(600 + 20, 400 + 20);#endif initControl();}BarEChartWidget::~BarEChartWidget(){ delete ui;}void BarEChartWidget::initControl(){ _pWebEngineView = new QWebEngineView(this); _pWebEnginePage = new QWebEnginePage(this); _pWebChannel = new QWebChannel(this); QString filePath;#if 1 filePath = QString("%1/%2").arg(_htmlDir).arg(_indexFileName);#else filePath = "qrc:/barEChartWidget/html/barEChartWidget.html";#endif LOG << "file exist:" << QFile::exists(filePath) << filePath;#if 0 // 打印html文件内容 QFile file(_indexFilePath); file.open(QIODevice::ReadOnly); LOG << QString(file.readAll()); file.close();#endif connect(_pWebEnginePage, SIGNAL(loadFinished(bool)), this, SLOT(slot_loadFinished(bool))); _pWebEnginePage->load(QUrl(filePath)); _pWebEnginePage->setWebChannel(_pWebChannel); _pWebEngineView->setPage(_pWebEnginePage); // 背景透明// _pWebEngineView->setStyleSheet("background-color: transparent"); _pWebEnginePage->setBackgroundColor(Qt::transparent);}void BarEChartWidget::slot_loadFinished(bool result){ if(result) { initJs(); }}void BarEChartWidget::initJs(){ _initJsStr = QSTRING( "var option;" "option = {" " tooltip: {" " trigger: 'axis'" " }," " grid: {" " left: '10'," " right: '10'," " top: '10'," " bottom: 30," " containLabel: true" " }," " legend: {" " orient: 'horizontal'," " x: 'center'," " y: 'bottom'," " itemGap: 20" " }," " xAxis: {" " type: 'value'" " }," " yAxis: {" " type: 'category'," " data: ['项目1', '项目2', '项目3']" " }," " series: [" " {" " name: '变量1'," " type: 'bar'," " stack: 'totla'," " label: {" " show: true" " }," " data: [11, 12, 13]" " }," " {" " name: '变量2'," " type: 'bar'," " stack: 'totla'," " label: {" " show: true" " }," " data: [24, 20, 21]" " }," " {" " name: '变量3'," " type: 'bar'," " stack: 'totla'," " label: {" " show: true" " }," " data: [95, 87, 55]" " }" " ]" "};" "myChart.setOption(option);"); runJsScript(_initJsStr);}void BarEChartWidget::runJsScript(QString str){ if(_pWebEnginePage) { _pWebEnginePage->runJavaScript(str); }}void BarEChartWidget::resizeEvent(QResizeEvent *event){ if(_pWebEngineView) { _pWebEngineView->setGeometry(ui->label_echarts->geometry()); }}void BarEChartWidget::on_pushButton_clear_clicked(){ QString jsStr = "option.series[0].data = [];" "option.series[1].data = [];" "option.series[2].data = [];" "myChart.setOption(option, true);"; runJsScript(jsStr);}void BarEChartWidget::on_pushButton_flush_clicked(){ QString jsStr = "var empty = {};" "myChart.setOption(empty, true);" "myChart.setOption(option, true);"; runJsScript(jsStr);}void BarEChartWidget::on_pushButton_createRandom_clicked(){ QString jsStr = "var min = 0;" "var max = 100;" "for(var i = 0; i < option.series.length; i++)" "{" " for(var j = 0; j < option.yAxis.data.length; j++)" " {" " option.series[i].data[j] = Math.floor(Math.random() * (max - min)) + min;" " }" "}" "myChart.setOption(option, true);"; runJsScript(jsStr);}void BarEChartWidget::on_pushButton_reset_clicked(){ initJs();}入坑
入坑一:调用js函数失败
问题
通过qt代码跑js调用函数失败。
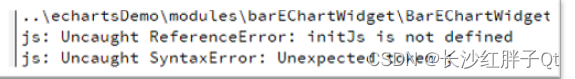
原理
先要等页面加载完成后才能调用定义的函数。
解决
发现是调用成功了,原来只定义也会报这个错误。
由此可以看出,在qt中去初始化需要等待页面加载完成才行。
入坑二:Qt的msvc编译器少数中文乱码
问题
少数中文乱码,加空格等都无法解决。
解决
最终解决了,尝试了QTextCodec等各种都不行,最终:
工程模板v1.2.0

后话
条形图将会根据实际需求持续升级版本,下一篇会继续折线图的基础封装。
上一篇:《Qt+ECharts开发笔记(二):Qt窗口动态调整大小,使ECharts跟随Qt窗口大小变换而变换大小》
下一篇:敬请期待…
若该文为原创文章,转载请注明原文出处
本文章博客地址:https://hpzwl.blog.csdn.net/article/details/125731144