Elastic:在 CentOS 上一步一步安装 Elastic Stack_Elastic
在我之前的许多文章中,我介绍了如何在 Ubuntu 系统上安装 Elasticsearch。没有 centos 的安装步骤。其中的原因是我自己没有一台 centos 的机器。在今天的教程中,我来详述如何使用 Vagrant 来安装 centos,并在它上面安装 Elastic Stack。
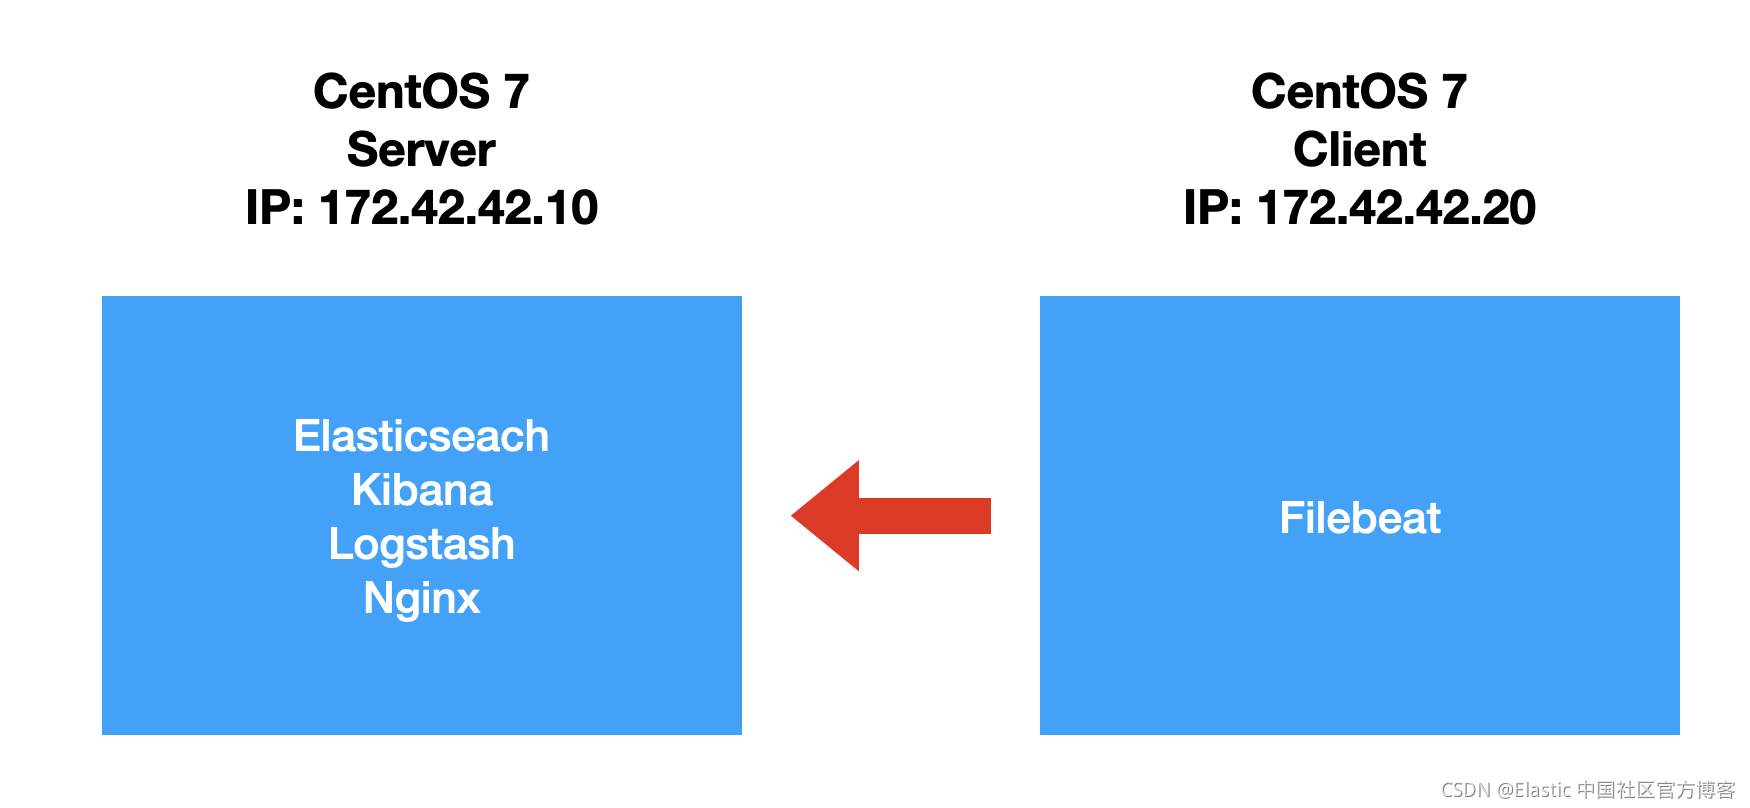
如果你从来还没有安装过 Vagrant,请参照我之前的教程 “Vagrant 入门教程” 来进行学习。在今天的练习中,我们使用如下的配置:
安装 centos
我们首先来使用 Vagrant 来创建一个 centos。我们首先在自己的一个目录下创建一个
Vagrantfile
# vi: set ft=ruby :

ENV['VAGRANT_NO_PARALLEL'] = 'yes'

Vagrant.configure(2) do |config|

  config.vm.provision "shell", path: "bootstrap.sh"

  config.vm.define "server" do |server|
    server.vm.box = "centos/7"
    server.vm.hostname = "server.example.com"
    server.vm.network "private_network", ip: "172.42.42.10"
    server.vm.provider "virtualbox" do |vb|
      vb.customize ["modifyvm", :id, "--natdnshostresolver1", "on"]
      vb.customize ["modifyvm", :id, "--natdnsproxy1", "on"]
      vb.name = "server"
      vb.memory = 2048
      vb.cpus = 1
    end
  end

  config.vm.define "client" do |client|
    client.vm.box = "centos/7"
    client.vm.hostname = "client.example.com"
    client.vm.network "private_network", ip: "172.42.42.20"
    client.vm.provider "virtualbox" do |vb|
      vb.customize ["modifyvm", :id, "--natdnshostresolver1", "on"]
      vb.customize ["modifyvm", :id, "--natdnsproxy1", "on"]
      vb.name = "client"
      vb.memory = 1024
      vb.cpus = 1
    end
  end

end
在上面,我们定义了两个 centos 的安装:server 及 client。我们将在 server 里安 Elasticsearch,Kibana, Logstash 及 Nginx。我们在 client 中安装 Filebeat 等。在上面,我们也同时指定了它们的 IP 地址。在上面,我们也同时指定了一个脚本 bootstrap.sh。它是用来帮我们安装一下必要的包及进行相应的配置:
bootstrap.sh
#!/bin/bash

# Update the system
echo "[TASK 1] Updating the system"
yum update -y >/dev/null 2>&1

# Install desired packages
echo "[TASK 2] Installing desired packages"
yum install -y -q vim redhat-lsb-core net-tools bind-utils >/dev/null 2>&1

# Set up global aliases and exports
echo "[TASK 3] Creating global aliases and functions"
cat >>/etc/bashrc <<EOF
# Generated by Vagrant
alias vi='vim'
alias sudo='sudo '
export EDITOR=vim
export TERM=xterm
# Generated by Vagrant
EOF

echo "colorscheme elflord" >> /etc/vimrc

# Enable password authentication
echo "[TASK 4] Enabling password authentication in sshd config"
sed -i 's/^PasswordAuthentication no/PasswordAuthentication yes/' /etc/ssh/sshd_config
systemctl reload sshd

# Disable SELinux
echo "[TASK 5] Disable SELinux"
setenforce 0
sed -i --follow-symlinks 's/^SELINUX=enforcing/SELINUX=disabled/' /etc/sysconfig/selinux

# Set Root password
echo "[TASK 6] Set root password"
echo "admin" | passwd --stdin root >/dev/null 2>&1

# Disable and stop firewalld
echo "[TASK 5] Disable and stop firewalld"
systemctl disable firewalld >/dev/null 2>&1
systemctl stop firewalld

# Update hosts file
echo "[TASK 6] Update /etc/hosts file"
cat >>/etc/hosts<<EOF
172.42.42.10 server.example.com server
172.42.42.20 client.example.com client
EOF
我们把上面的两个文件放入一个目录下,并打入如下的命令:
vagrant up
我们需要等一会完成这个安装。我们可以使用如下的命令来检查 images:
vagrant box list$ vagrant box list
centos/7 (virtualbox, 2004.01)上面显示 centos/7 已经成功下下载。
我们在自己的电脑的 /etc/hosts 中,添加如下的句子:
172.42.42.10 server.example.com server
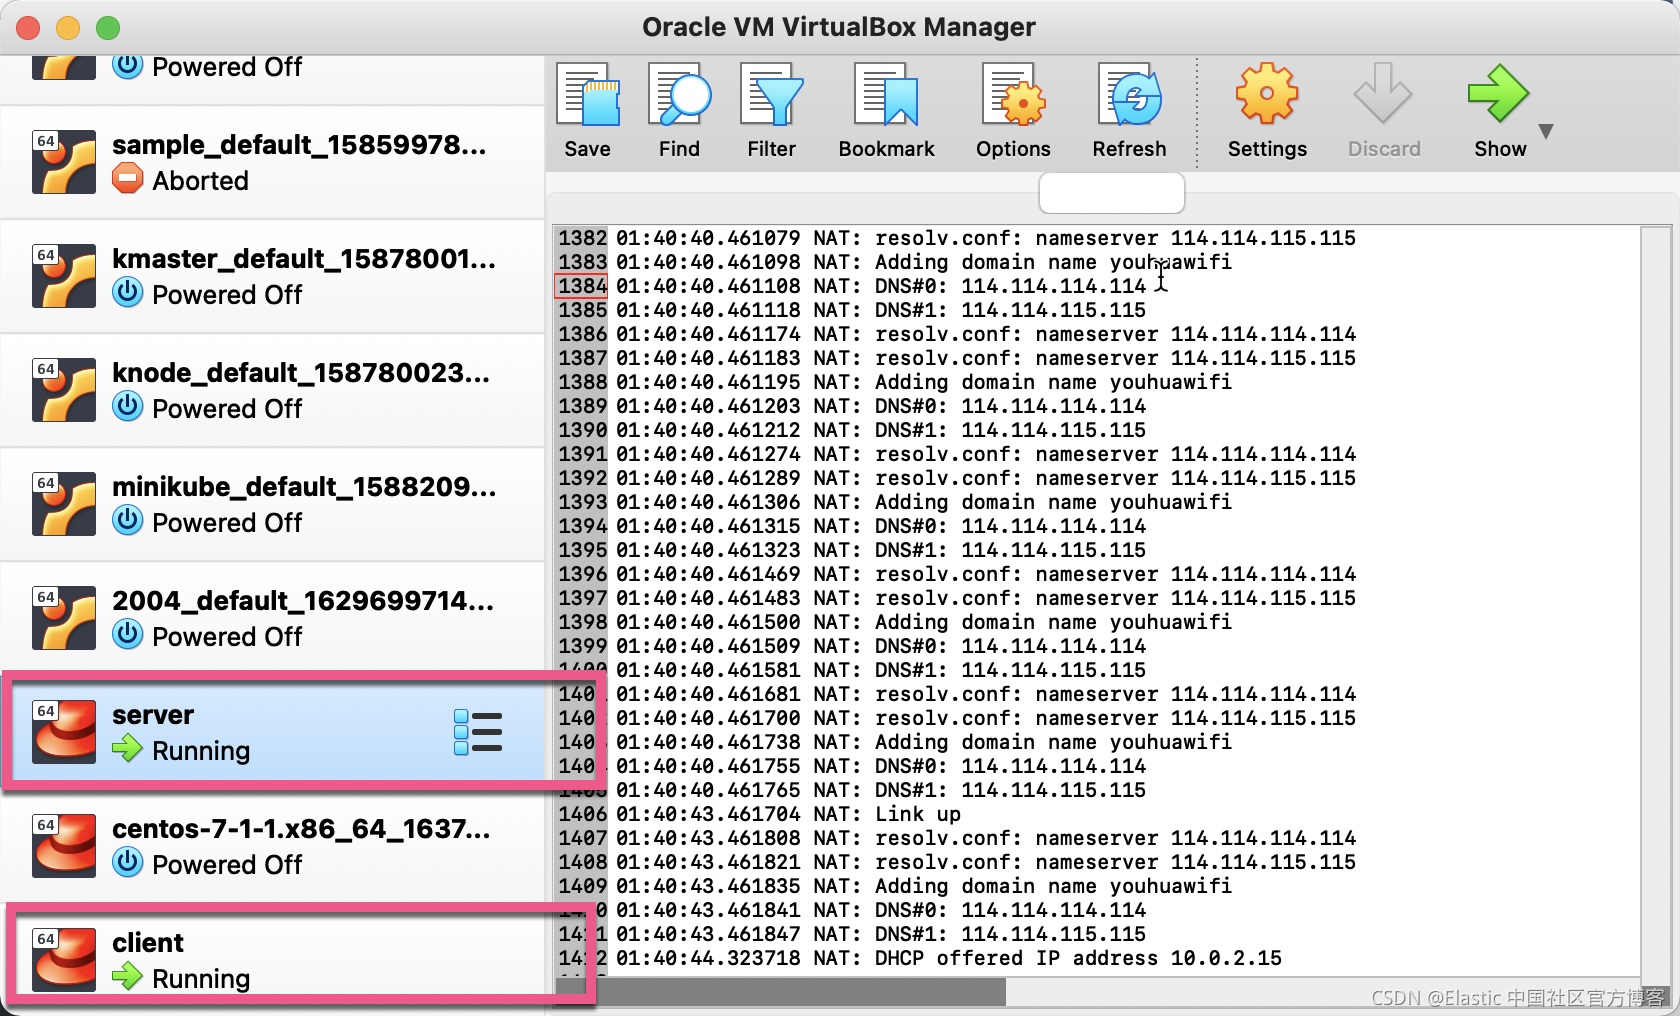
172.42.42.20 client.example.com client这里的 IP 地址对应于我们的 virtualbox IP 地址。我们打开 Virtualbox,我们会发现有两个 box 正在运行:
我们可使用如下的命令来检查 server 及 client 是否已经运行起来了:
$ ping server
PING server.example.com (172.42.42.10): 56 data bytes
64 bytes from 172.42.42.10: icmp_seq=0 ttl=64 time=0.233 ms
64 bytes from 172.42.42.10: icmp_seq=1 ttl=64 time=0.611 ms

--- server.example.com ping statistics ---
2 packets transmitted, 2 packets received, 0.0% packet loss
round-trip min/avg/max/stddev = 0.233/0.422/0.611/0.189 ms
$ ping client
PING client.example.com (172.42.42.20): 56 data bytes
64 bytes from 172.42.42.20: icmp_seq=0 ttl=64 time=0.462 ms
64 bytes from 172.42.42.20: icmp_seq=1 ttl=64 time=0.270 ms
从上面的输出中,我们可以看出来 server 及 client 都分别已经运行起来了。
我们可以使用如下的命令来进入 server box:
vagrant ssh server$ vagrant ssh server
Last login: Fri Nov 19 08:59:27 2021 from 10.0.2.2
-bash: warning: setlocale: LC_CTYPE: cannot change locale (UTF-8): No such file or directory
[vagrant@server ~]$ 或者直接在 host 里打入如下的命令:
$ ssh root@server等进入到 centos 后,我们可以检查 centos 的版本:
[vagrant@server ~]$ lsb_release -dirc
Distributor ID:	CentOS
Description:	CentOS Linux release 7.9.2009 (Core)
Release:	7.9.2009
Codename:	Core
[vagrant@server ~]$ sestatus
SELinux status: disabled[vagrant@server ~]$ getenforce
Disabled[vagrant@server ~]$ systemctl status filewalldl
Unit filewalldl.service could not be found.[vagrant@server ~]$ systemctl status firewalld
● firewalld.service - firewalld - dynamic firewall daemon
Loaded: loaded (/usr/lib/systemd/system/firewalld.service; disabled; vendor preset: enabled)
Active: inactive (dead)
Docs: man:firewalld(1)我们可以看到这些都是在 bootstrap.sh 脚本里定义的我们希望提前做的一些动作。
我们查看 /etc/hosts
[vagrant@server ~]$ cat /etc/hosts
127.0.0.1   localhost localhost.localdomain localhost4 localhost4.localdomain4
::1         localhost localhost.localdomain localhost6 localhost6.localdomain6
172.42.42.10 server.example.com server
172.42.42.20 client.example.com client
这个也是在 bootstrap.sh 中的如下的脚本:
# Update hosts file
echo "[TASK 6] Update /etc/hosts file"
cat >>/etc/hosts<<EOF
172.42.42.10 server.example.com server
172.42.42.20 client.example.com client
EOF
我们可以在 server 中 ping client:
[vagrant@server ~]$ ping client
PING client.example.com (172.42.42.20) 56(84) bytes of data.
64 bytes from client.example.com (172.42.42.20): icmp_seq=1 ttl=64 time=0.901 ms
64 bytes from client.example.com (172.42.42.20): icmp_seq=2 ttl=64 time=0.466 ms
按照 Elasticsearch
接下来的所有的操作都是在 server 里进行的。由于大多数是按照操作,需要使用 sudo,所以我们使用 root 来进行登录:
ssh root@server$ ssh root@server
The authenticity of host 'server (172.42.42.10)' can't be established.
ECDSA key fingerprint is SHA256:T3McRBs+YDcrprJE2FazITq6wmTSutkDqgnuPAQy5O4.
Are you sure you want to continue connecting (yes/no/[fingerprint])? yes
Warning: Permanently added 'server,172.42.42.10' (ECDSA) to the list of known hosts.
root@server's password: 我们在 bootstrap 里定义了 root 的密码为 admin。打入该密码即可。这样我们就进入到 centos:
$ ssh root@server
root@server's password:
-bash: warning: setlocale: LC_CTYPE: cannot change locale (UTF-8): No such file or directory
[root@server ~]#
安装 Java 8
我们在 server 里打入如下的命令来安装 Java 8:
yum install -y java-1.8.0-openjdk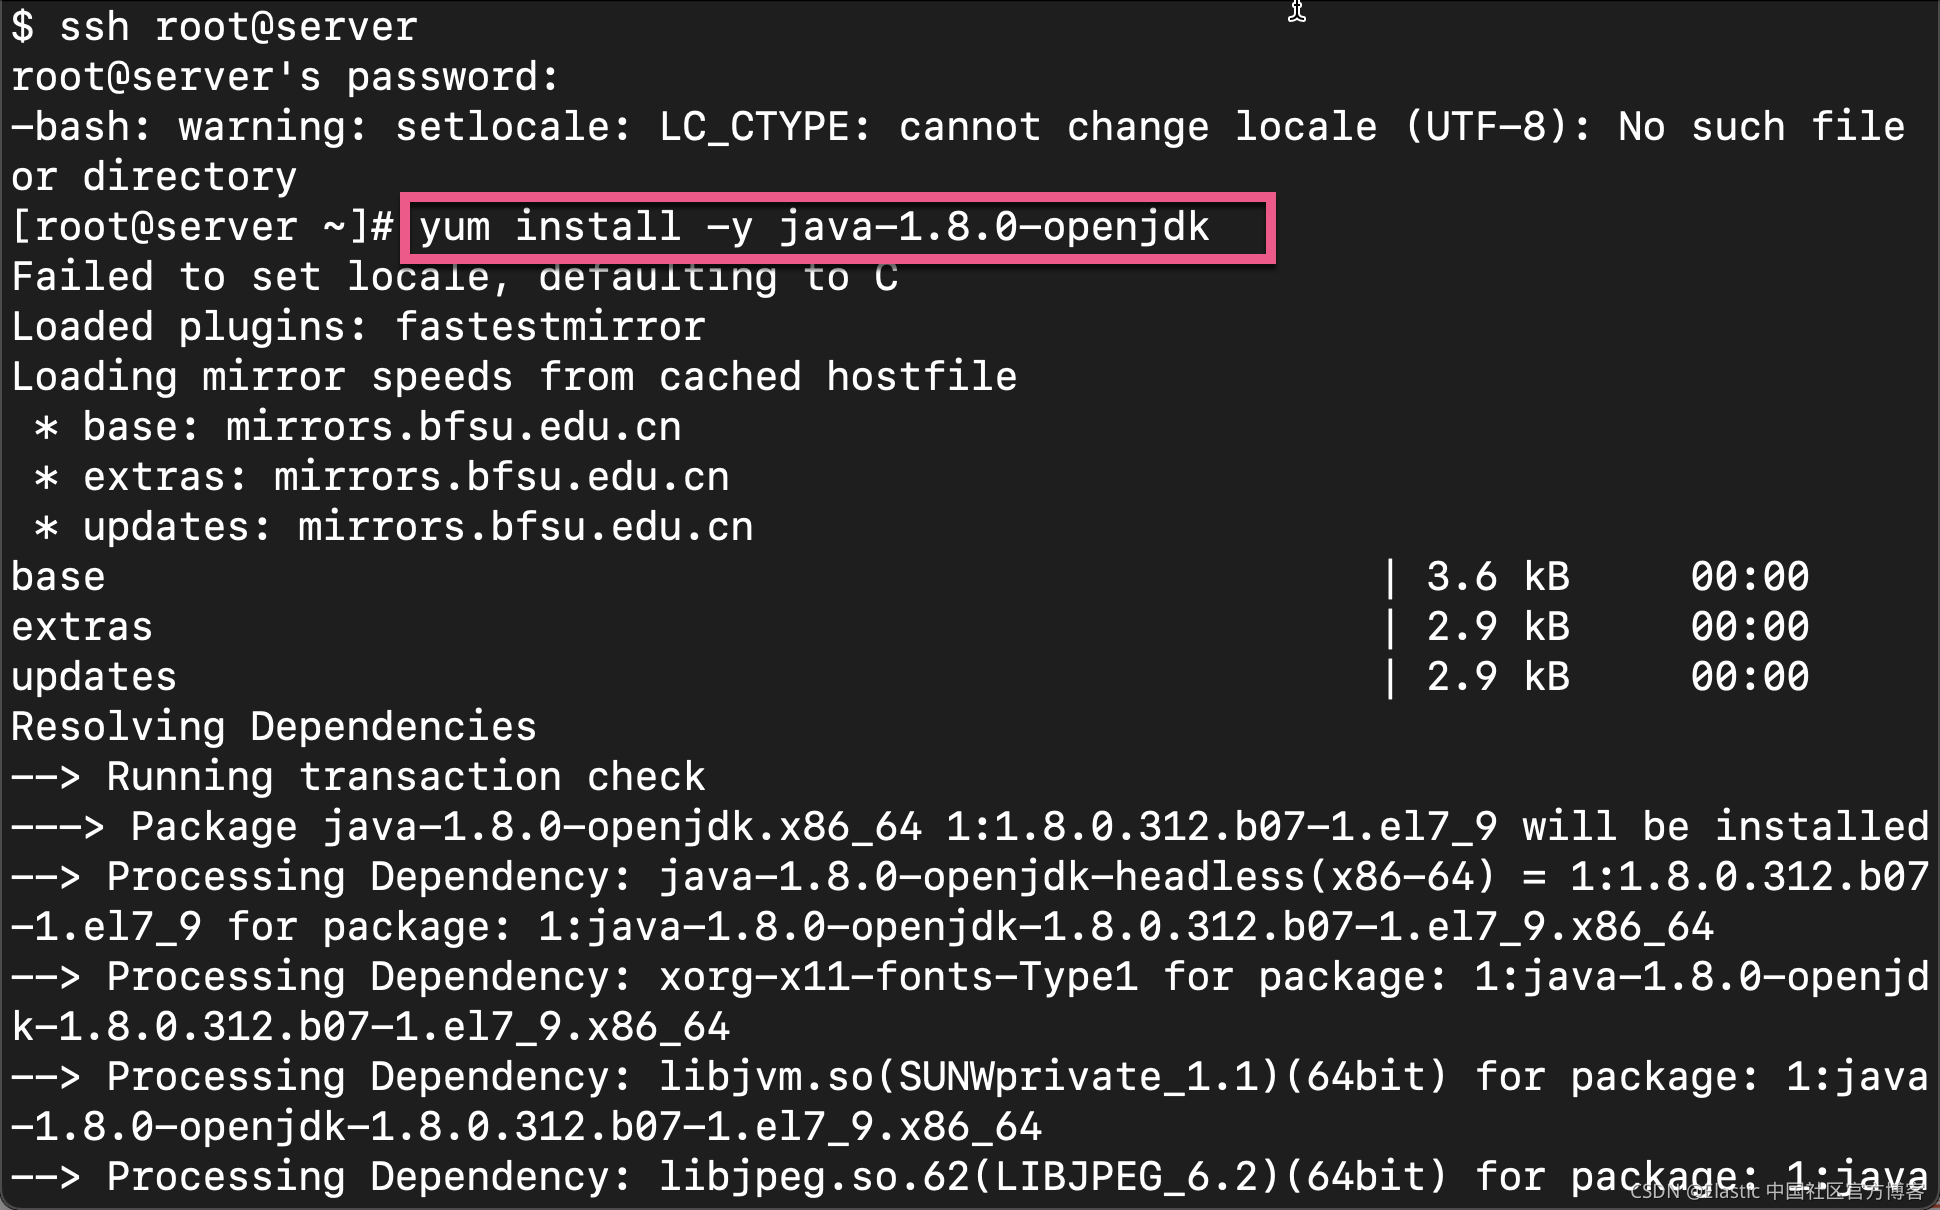
等 Java 8 安装完毕后。我们检查一下 Java 的版本:
[root@server ~]# java -version
openjdk version "1.8.0_312"
OpenJDK Runtime Environment (build 1.8.0_312-b07)
OpenJDK 64-Bit Server VM (build 25.312-b07, mixed mode)
使用如下的命令来导入 PGP Key:
rpm --import https://artifacts.elastic.co/GPG-KEY-elasticsearch我们接下来创建 Yum repository。我们打入如下的命令:
cat >>/etc/yum.repos.d/elk.repo<<EOF
[ELK-7.x]
name=ELK repository for 7.x packages
baseurl=https://artifacts.elastic.co/packages/7.x/yum
gpgcheck=1
gpgkey=https://artifacts.elastic.co/GPG-KEY-elasticsearch
enabled=1
autorefresh=1
type=rpm-md
EOF
在上面,我们安装 Elasticsearch 7.x 版本:
[root@server ~]# cat >>/etc/yum.repos.d/elk.repo<<EOF
> [ELK-7.x]
> name=ELK repository for 7.x packages
> baseurl=https://artifacts.elastic.co/packages/7.x/yum
> gpgcheck=1
> gpgkey=https://artifacts.elastic.co/GPG-KEY-elasticsearch
> enabled=1
> autorefresh=1
> type=rpm-md
> EOF
[root@server ~]# cat /etc/yum.repos.d/elk.repo
[ELK-7.x]
name=ELK repository for 7.x packages
baseurl=https://artifacts.elastic.co/packages/7.x/yum
gpgcheck=1
gpgkey=https://artifacts.elastic.co/GPG-KEY-elasticsearch
enabled=1
autorefresh=1
type=rpm-md
接下来,我们来安装 Elasticsearch:
yum install -y elasticsearch

上面显示,我们的 Elasticsearch 已经安装完毕。
我们接下来启动 Elasticsearch 服务,这样每次 centos 启动后,Elasticsearch 将会被自动启动:
systemctl daemon-reload
systemctl enable elasticsearch
systemctl start elasticsearch
[root@server ~]# systemctl daemon-reload
[root@server ~]# systemctl enable elasticsearch
Created symlink from /etc/systemd/system/multi-user.target.wants/elasticsearch.service to /usr/lib/systemd/system/elasticsearch.service.
[root@server ~]# systemctl start elasticsearch我们可以通过如下的命令来检查 Elasticsearch 的配置文件位置:
[root@server ~]# rpm -qc elasticsearch
/etc/elasticsearch/elasticsearch.yml
/etc/elasticsearch/jvm.options
/etc/elasticsearch/log4j2.properties
/etc/elasticsearch/role_mapping.yml
/etc/elasticsearch/roles.yml
/etc/elasticsearch/users
/etc/elasticsearch/users_roles
/etc/init.d/elasticsearch
/etc/sysconfig/elasticsearch
/usr/lib/sysctl.d/elasticsearch.conf
/usr/lib/systemd/system/elasticsearch.service
如果我们需要针对 Elasticsearch 做任何的配置,我们可以找到相应的文件位置,并对它进行修改。
我们可以在如下的位置查看 Elasticsearch 相关的日志:
[root@server ~]# ls /var/log/elasticsearch/
elasticsearch.log
elasticsearch_audit.json
elasticsearch_deprecation.json
elasticsearch_deprecation.log
elasticsearch_index_indexing_slowlog.json
elasticsearch_index_indexing_slowlog.log
elasticsearch_index_search_slowlog.json
elasticsearch_index_search_slowlog.log
elasticsearch_server.json
gc.log
gc.log.00
我们也可以使用如下的命令来查看 Elasticsearch 的日志:
[root@server ~]# journalctl --unit elasticsearch
-- Logs begin at Fri 2021-11-19 08:46:38 UTC, end at Sat 2021-11-20 02:29:12 UTC
Nov 20 02:28:48 server.example.com systemd[1]: Starting Elasticsearch...
Nov 20 02:28:50 server.example.com systemd-entrypoint[2778]: WARNING: A terminal
Nov 20 02:28:50 server.example.com systemd-entrypoint[2778]: WARNING: System::se
Nov 20 02:28:50 server.example.com systemd-entrypoint[2778]: WARNING: Please con
Nov 20 02:28:50 server.example.com systemd-entrypoint[2778]: WARNING: System::se
Nov 20 02:28:52 server.example.com systemd-entrypoint[2778]: WARNING: A terminal
Nov 20 02:28:52 server.example.com systemd-entrypoint[2778]: WARNING: System::se
Nov 20 02:28:52 server.example.com systemd-entrypoint[2778]: WARNING: Please con
Nov 20 02:28:52 server.example.com systemd-entrypoint[2778]: WARNING: System::se
Nov 20 02:29:12 server.example.com systemd[1]: Started Elasticsearch.
我们可以通过如下的命令来检查 Elasticsearch 的运行端口:
[root@server ~]# netstat -nltp
Active Internet connections (only servers)
Proto Recv-Q Send-Q Local Address           Foreign Address         State       PID/Program name
tcp        0      0 0.0.0.0:111             0.0.0.0:*               LISTEN      381/rpcbind
tcp        0      0 0.0.0.0:22              0.0.0.0:*               LISTEN      629/sshd
tcp        0      0 127.0.0.1:25            0.0.0.0:*               LISTEN      842/master
tcp6       0      0 :::111                  :::*                    LISTEN      381/rpcbind
tcp6       0      0 127.0.0.1:9200          :::*                    LISTEN      2778/java
tcp6       0      0 ::1:9200                :::*                    LISTEN      2778/java
tcp6       0      0 127.0.0.1:9300          :::*                    LISTEN      2778/java
tcp6       0      0 ::1:9300                :::*                    LISTEN      2778/java
tcp6       0      0 :::22                   :::*                    LISTEN      629/sshd
tcp6       0      0 ::1:25                  :::*                    LISTEN      842/master
从上面,我们可以看到 127.0.0.1:9200 及 127.0.0.1:9300 两个端口地址。它们都是来自 Elasticsearch 的安装。
我们可以使用如下的方式来检查我们的 Elasticsearch 的安装是否成功:
[root@server ~]# curl http://localhost:9200
{
  "name" : "server.example.com",
  "cluster_name" : "elasticsearch",
  "cluster_uuid" : "kUgkYn4RRCGemjJVtLbfqw",
  "version" : {
    "number" : "7.15.2",
    "build_flavor" : "default",
    "build_type" : "rpm",
    "build_hash" : "93d5a7f6192e8a1a12e154a2b81bf6fa7309da0c",
    "build_date" : "2021-11-04T14:04:42.515624022Z",
    "build_snapshot" : false,
    "lucene_version" : "8.9.0",
    "minimum_wire_compatibility_version" : "6.8.0",
    "minimum_index_compatibility_version" : "6.0.0-beta1"
  },
  "tagline" : "You Know, for Search"
}
安装 Kibana
接下来,我们来安装 Kibana。我们直接使用如下的命令来进行安装:
yum install -y kibana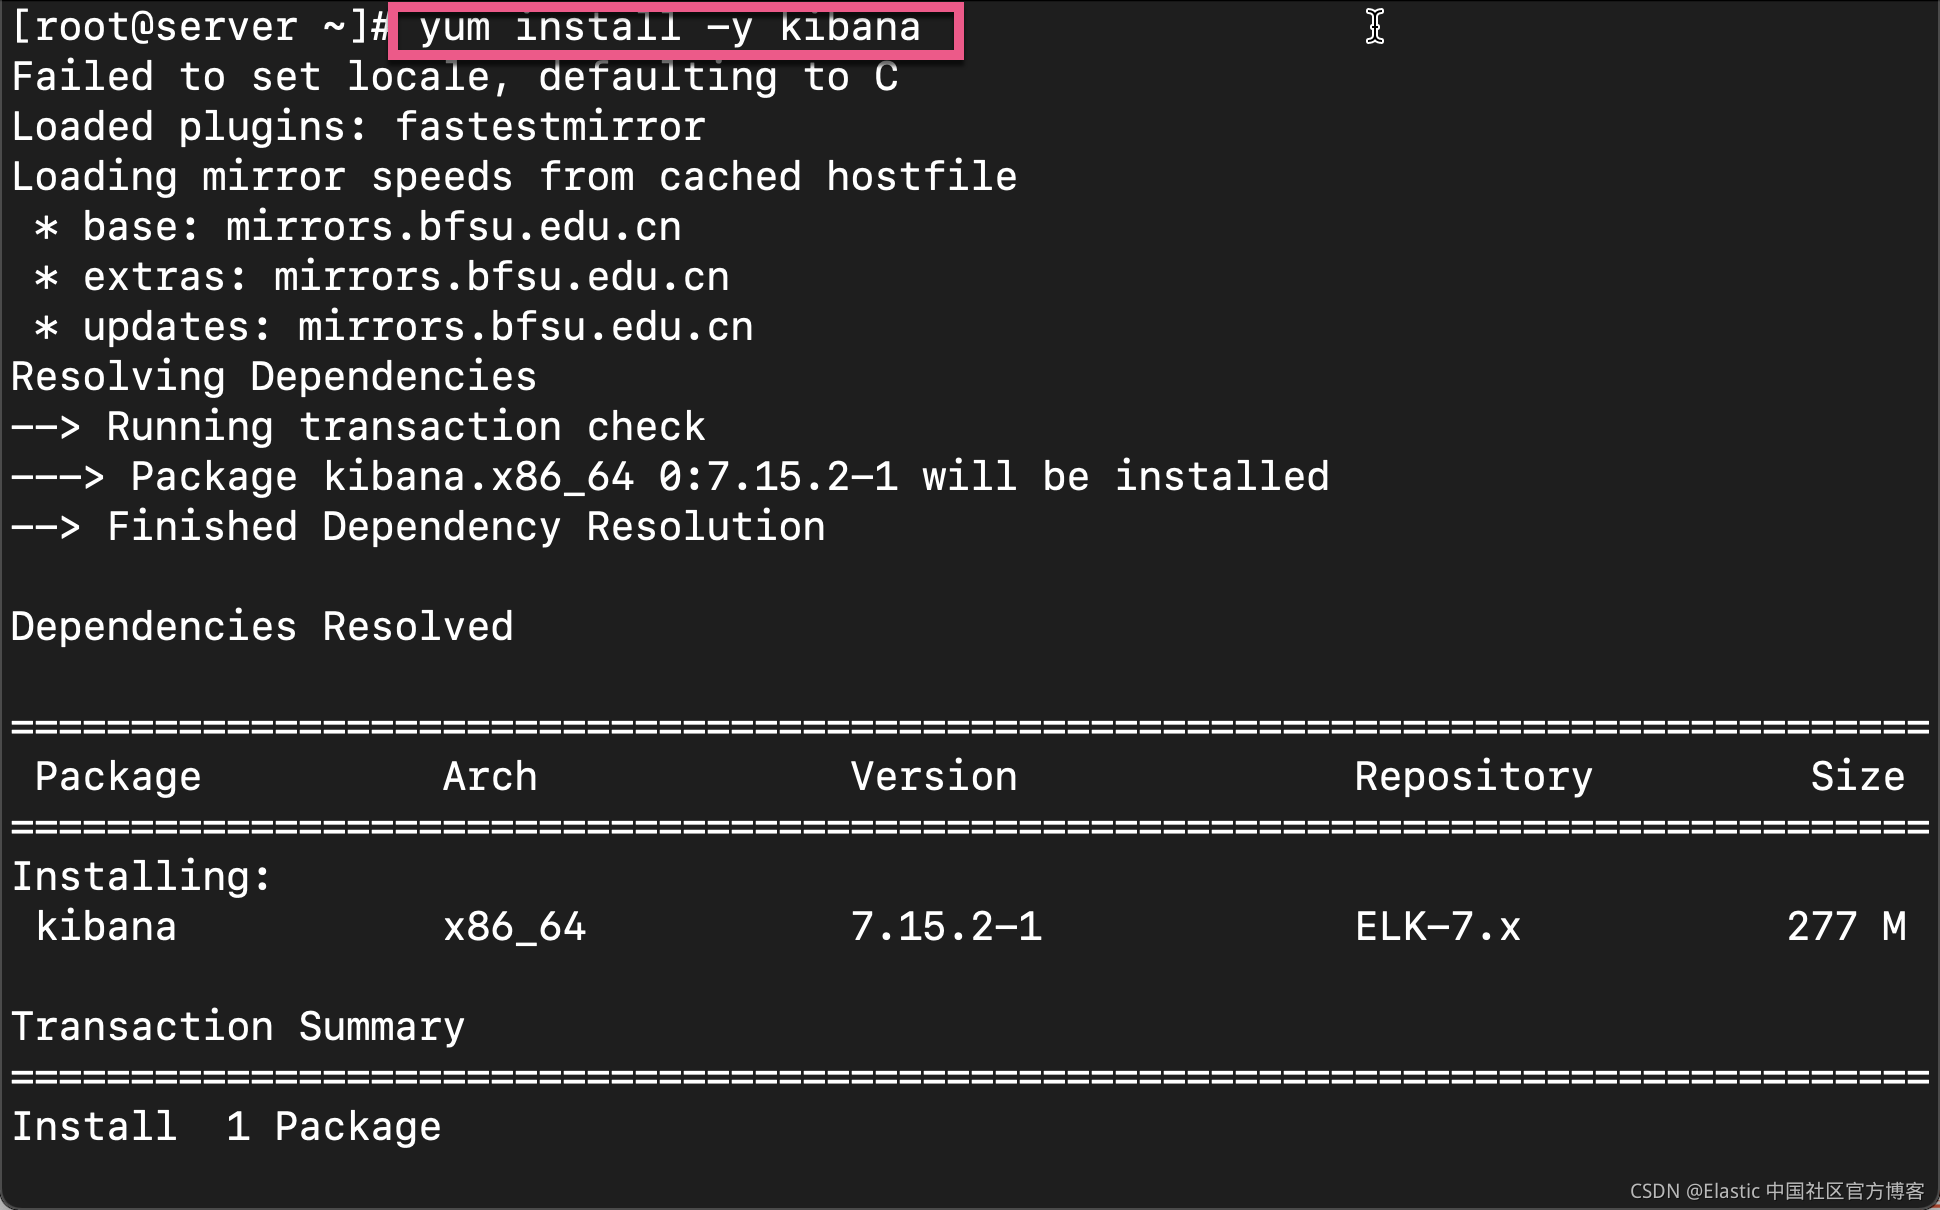

上面显示我们的 Kibana 已经成功地被安装好了。
按照和 Elasticsearch 一样的步骤,我们启动 Kibana 服务:
systemctl daemon-reload
systemctl enable kibana
systemctl start kibana
[root@server ~]# systemctl daemon-reload
[root@server ~]# systemctl enable kibana
Created symlink from /etc/systemd/system/multi-user.target.wants/kibana.service to /etc/systemd/system/kibana.service.
[root@server ~]# systemctl start kibana我们可以通过如下的命令来查看 Kibana 的配置文件地址:
rpm -qc kibana[root@server ~]# rpm -qc kibana
/etc/kibana/kibana.yml我们可以通过如下的命令来查看 Kibana 的日志信息:
[root@server ~]# rpm -qc kibana
/etc/kibana/kibana.yml
[root@server ~]# journalctl --unit kibana
-- Logs begin at Fri 2021-11-19 08:46:38 UTC, end at Sat 2021-11-20 02:47:56 UTC
Nov 20 02:47:56 server.example.com systemd[1]: Started Kibana.我们需要等一段时间等 Kibana 完全启动后,我们使用如下的命令来进行检查网络端口的使用情况:
[root@server ~]# netstat -nltp
Active Internet connections (only servers)
Proto Recv-Q Send-Q Local Address           Foreign Address         State       PID/Program name
tcp        0      0 0.0.0.0:111             0.0.0.0:*               LISTEN      381/rpcbind
tcp        0      0 0.0.0.0:22              0.0.0.0:*               LISTEN      629/sshd
tcp        0      0 127.0.0.1:25            0.0.0.0:*               LISTEN      842/master
tcp        0      0 127.0.0.1:5601          0.0.0.0:*               LISTEN      3094/node
tcp6       0      0 :::111                  :::*                    LISTEN      381/rpcbind
tcp6       0      0 127.0.0.1:9200          :::*                    LISTEN      2778/java
tcp6       0      0 ::1:9200                :::*                    LISTEN      2778/java
tcp6       0      0 127.0.0.1:9300          :::*                    LISTEN      2778/java
tcp6       0      0 ::1:9300                :::*                    LISTEN      2778/java
tcp6       0      0 :::22                   :::*                    LISTEN      629/sshd
tcp6       0      0 ::1:25                  :::*                    LISTEN      842/master
在上面,我们明显看到新增加了一个端口地址 127.0.0.1:5601。这个就是 Kibana 的端口地址。
安装 Nginx
到目前位置,我们发现 Elasticsearch 及 Kibana 只能被在 Box 里进行访问。我们无法使用我们的 host 机器进行访问。为此,我们安装 Nginx 来提供外部访问。
首先,我们来安装 Nginx:
yum install -y epel-release
yum install -y nginx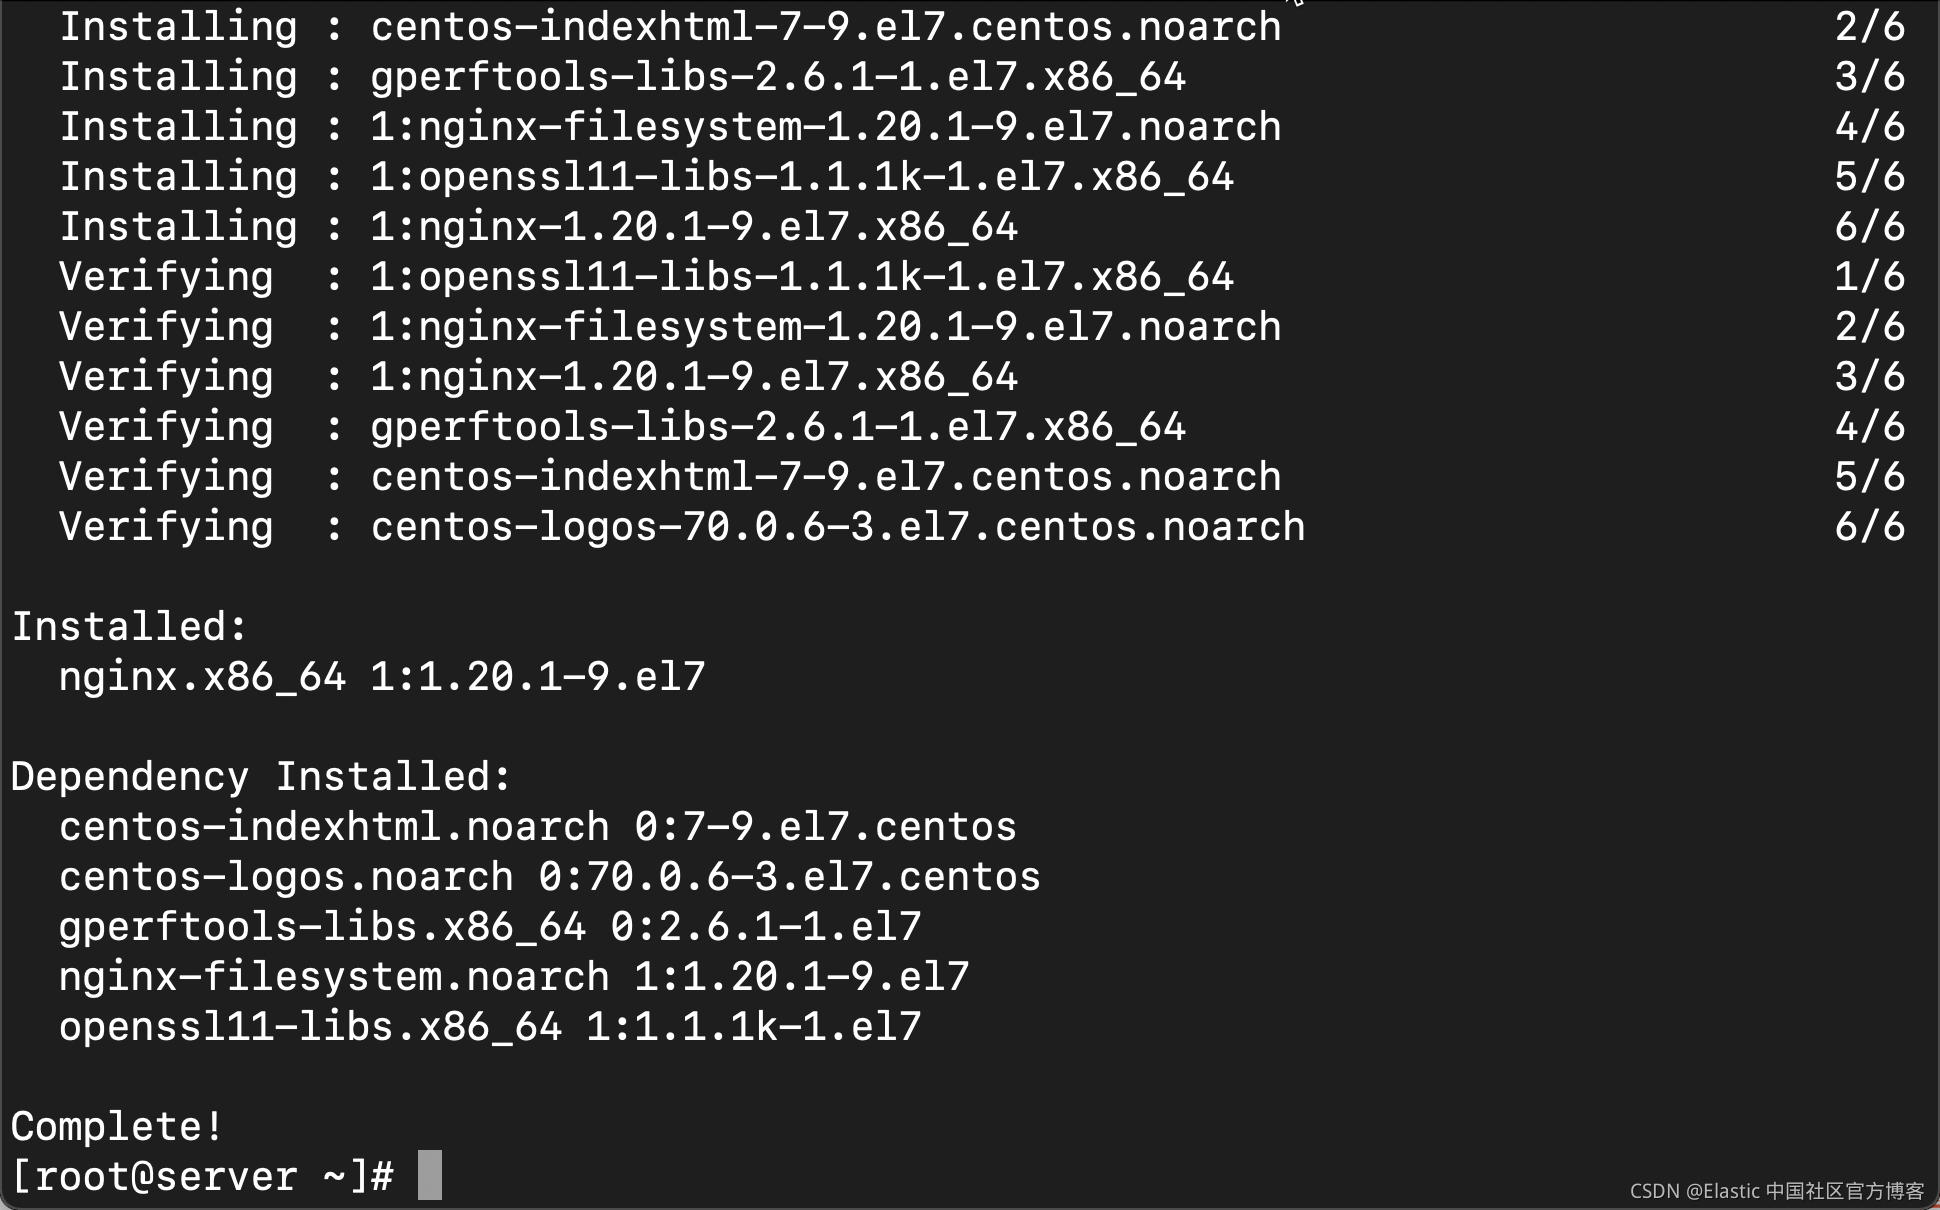
接下来,我们来提供一个 proxy 的配置。首先我们删除在 /etc/nginx/nginx.conf 文件里的 server block。
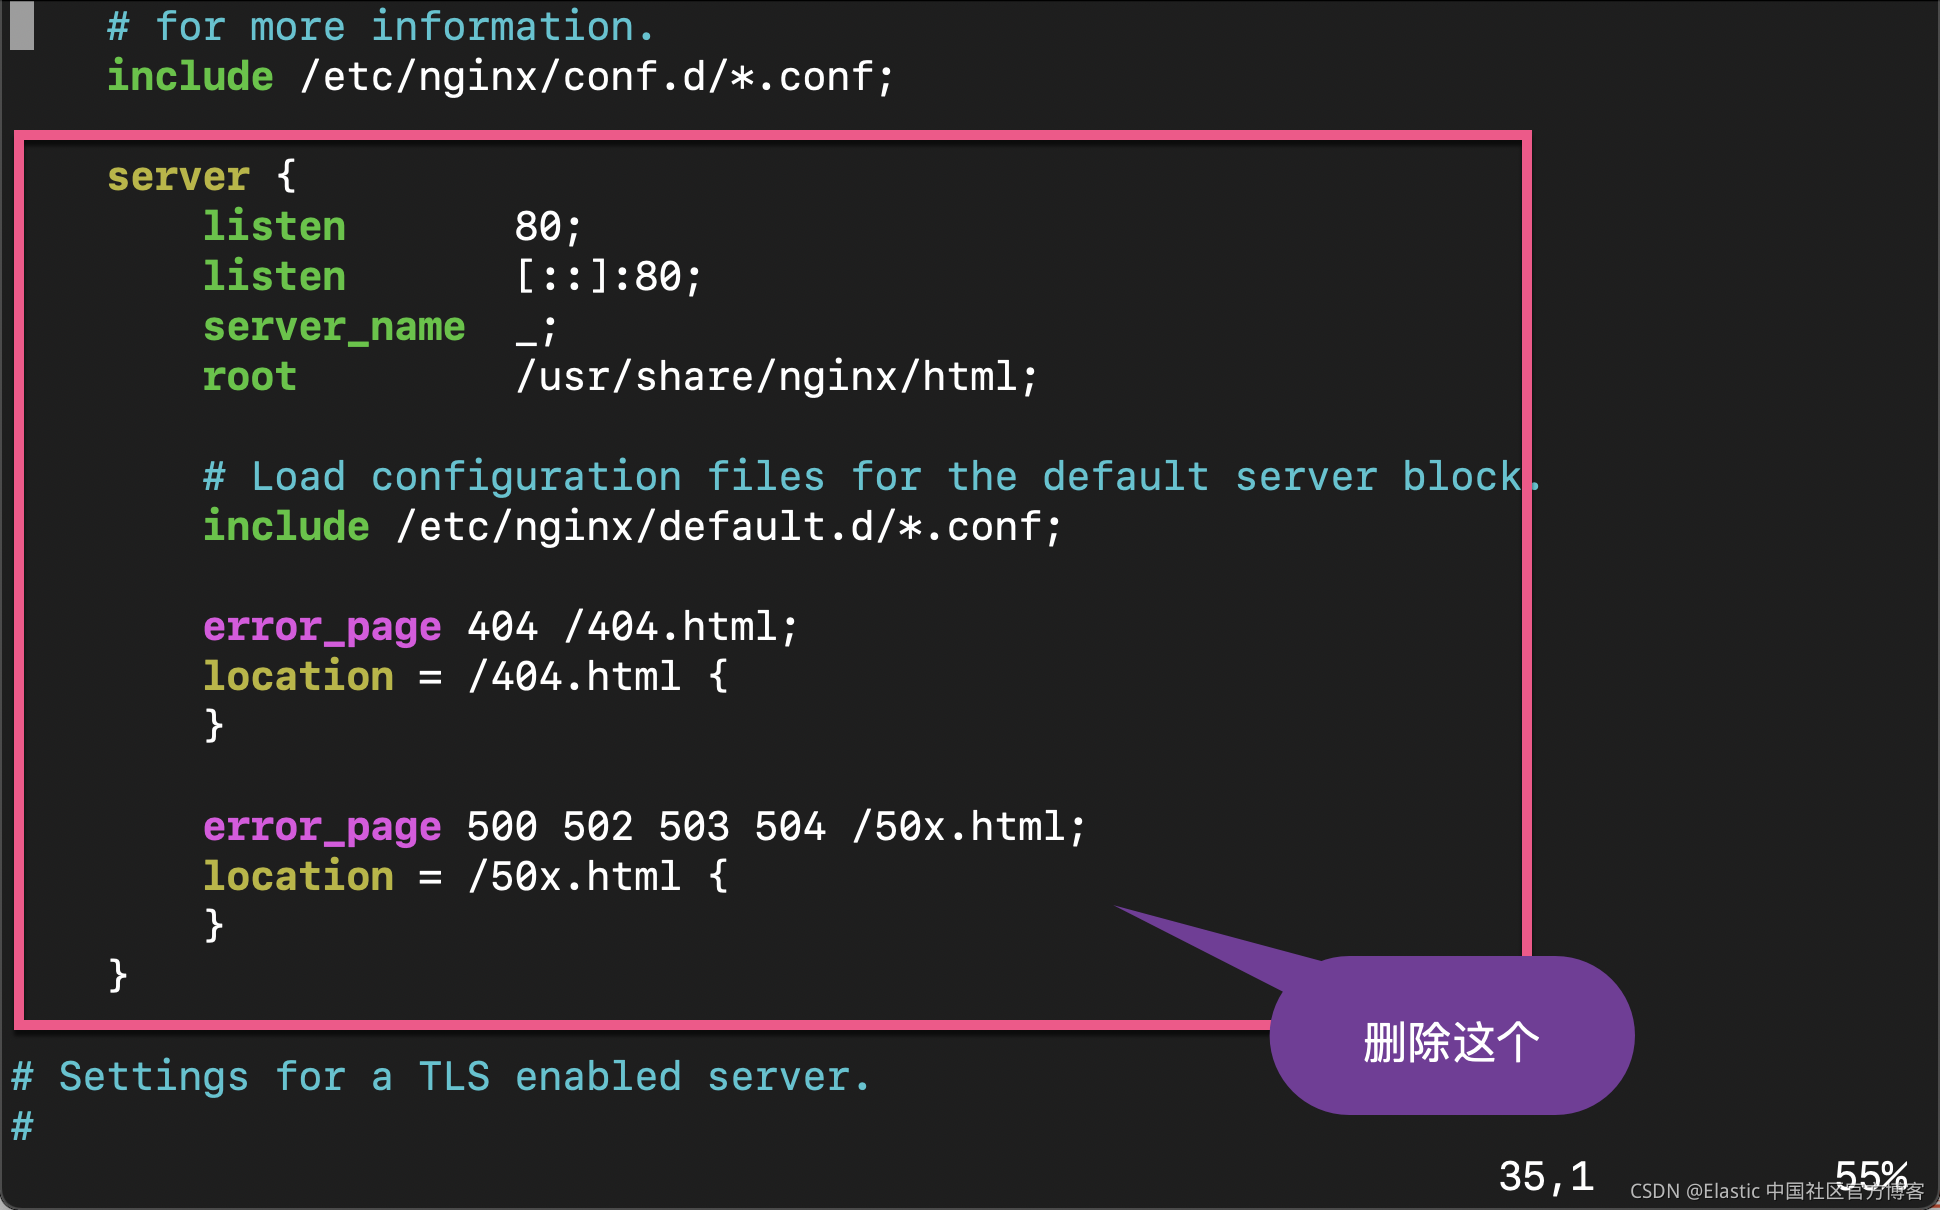
然后使用如下的命令来创建一个新的 conf 文件:
[root@server ~]# vi /etc/nginx/nginx.conf
[root@server ~]# cat >>/etc/nginx/conf.d/kibana.conf<<EOF
> server {
>     listen 80;
>     server_name server.example.com;
>     location / {
>         proxy_pass http://localhost:5601;
>     }
> }
> EOF
[root@server ~]# cat /etc/nginx/conf.d/kibana.conf
server {
    listen 80;
    server_name server.example.com;
    location / {
        proxy_pass http://localhost:5601;
    }
}
我们接下来使用如下的命令来启动 nginx 服务:
[root@server ~]# systemctl enable nginx
Created symlink from /etc/systemd/system/multi-user.target.wants/nginx.service to /usr/lib/systemd/system/nginx.service.
[root@server ~]# systemctl start nginx
我们使用如下的命令来检查端口的使用情况:
[root@server ~]# netstat -nltp
Active Internet connections (only servers)
Proto Recv-Q Send-Q Local Address           Foreign Address         State       PID/Program name
tcp        0      0 0.0.0.0:111             0.0.0.0:*               LISTEN      381/rpcbind
tcp        0      0 0.0.0.0:80              0.0.0.0:*               LISTEN      9913/nginx: master
tcp        0      0 0.0.0.0:22              0.0.0.0:*               LISTEN      629/sshd
tcp        0      0 127.0.0.1:25            0.0.0.0:*               LISTEN      842/master
tcp        0      0 127.0.0.1:5601          0.0.0.0:*               LISTEN      3094/node
tcp6       0      0 :::111                  :::*                    LISTEN      381/rpcbind
tcp6       0      0 127.0.0.1:9200          :::*                    LISTEN      2778/java
tcp6       0      0 ::1:9200                :::*                    LISTEN      2778/java
tcp6       0      0 127.0.0.1:9300          :::*                    LISTEN      2778/java
tcp6       0      0 ::1:9300                :::*                    LISTEN      2778/java
tcp6       0      0 :::22                   :::*                    LISTEN      629/sshd
tcp6       0      0 ::1:25                  :::*                    LISTEN      842/master
在上面,我们可以看到新增加的 0 0.0.0.0:80 端口。
细心的开发者这个时候,我们可以在 host 机器上使用浏览器来访问 Kibana:

我们可以看到 Kibana 已经被成功地启动了。
安装 Logstash
我们直接使用如下的命令来进行安装:
yum install -y logstash
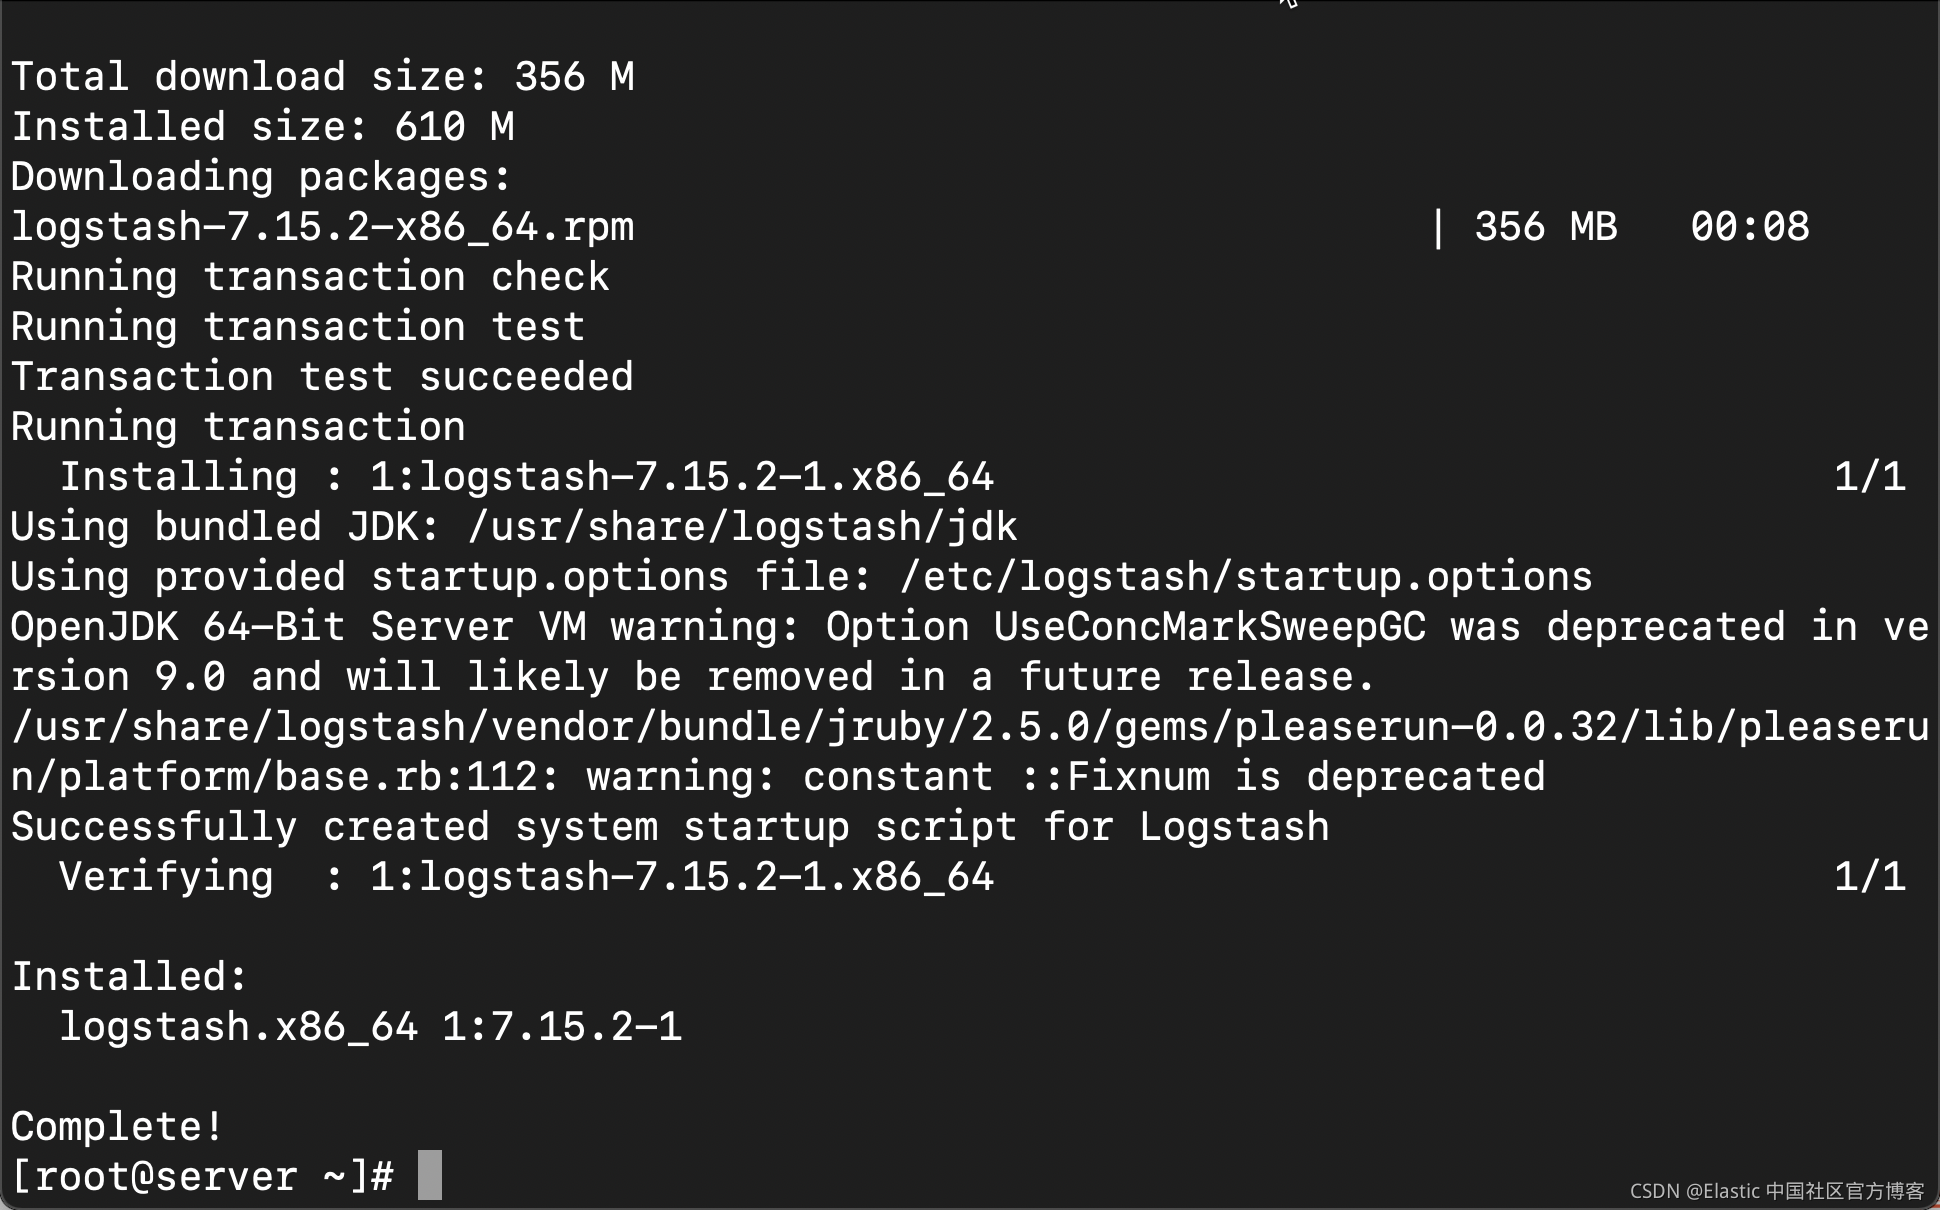
上面显示安装已经完成。
接下来,我们创建 SSL 证书:
openssl req -subj '/CN=server.example.com/' -x509 -days 3650 -nodes -batch -newkey rsa:2048 -keyout /etc/pki/tls/private/logstash.key -out /etc/pki/tls/certs/logstash.crt[root@server ~]# openssl req -subj '/CN=server.example.com/' -x509 -days 3650 -nodes -batch -newkey rsa:2048 -keyout /etc/pki/tls/private/logstash.key -out /etc/pki/tls/certs/logstash.crt
Generating a 2048 bit RSA private key
.................................+++
............+++
writing new private key to '/etc/pki/tls/private/logstash.key'
-----接下来,我们来创建一个 Logstash pipeline:
vi /etc/logstash/conf.d/01-logstash-simple.conf这个文件的内容如下:
input {
  beats {
    port => 5044
    ssl => true
    ssl_certificate => "/etc/pki/tls/certs/logstash.crt"
    ssl_key => "/etc/pki/tls/private/logstash.key"
  }
}

filter {
    if [type] == "syslog" {
        grok {
            match => {
                "message" => "%{SYSLOGTIMESTAMP:syslog_timestamp} %{SYSLOGHOST:syslog_hostname} %{DATA:syslog_program}(?:\[%{POSINT:syslog_pid}\])?: %{GREEDYDATA:syslog_message}"
            }
            add_field => [ "received_at", "%{@timestamp}" ]
            add_field => [ "received_from", "%{host}" ]
        }
        syslog_pri { }
        date {
            match => [ "syslog_timestamp", "MMM  d HH:mm:ss", "MMM dd HH:mm:ss" ]
        }
    }
}

output {
    elasticsearch {
        hosts => "localhost:9200"
        index => "%{[@metadata][beat]}-%{+YYYY.MM.dd}"
    }
}
详细描述这个 Logstash 的管道已经超出本教程的范围。简单地说就是侦听端口 5044,然后把数据传入到 filter 并进行解析。最终把数据写入到 Elasticsearch 中。
我们接下来启动 Logstash 服务:
systemctl enable logstash
systemctl start logstash
[root@server ~]# systemctl enable logstash
Created symlink from /etc/systemd/system/multi-user.target.wants/logstash.service to /etc/systemd/system/logstash.service.
[root@server ~]# systemctl start logstash我们可以通过如下的命令来检查 Logstash 的日志:
[root@server ~]# journalctl -u logstash
-- Logs begin at Fri 2021-11-19 08:46:38 UTC, end at Sat 2021-11-20 03:29:20 UTC
Nov 20 03:28:31 server.example.com systemd[1]: Started logstash.
Nov 20 03:28:31 server.example.com logstash[10183]: Using bundled JDK: /usr/shar
Nov 20 03:28:31 server.example.com logstash[10183]: OpenJDK 64-Bit Server VM war
Nov 20 03:29:15 server.example.com logstash[10183]: Sending Logstash logs to /va
Nov 20 03:29:16 server.example.com logstash[10183]: [2021-11-20T03:29:15,996][IN
Nov 20 03:29:16 server.example.com logstash[10183]: [2021-11-20T03:29:16,008][IN
Nov 20 03:29:16 server.example.com logstash[10183]: [2021-11-20T03:29:16,032][IN
Nov 20 03:29:16 server.example.com logstash[10183]: [2021-11-20T03:29:16,066][IN
Nov 20 03:29:16 server.example.com logstash[10183]: [2021-11-20T03:29:16,996][IN
Nov 20 03:29:19 server.example.com logstash[10183]: [2021-11-20T03:29:19,736][IN
Nov 20 03:29:20 server.example.com logstash[10183]: [2021-11-20T03:29:2
我们使用如下的命令来检查 Logstash 的端口使用情况:
[root@server ~]# netstat -nltp
Active Internet connections (only servers)
Proto Recv-Q Send-Q Local Address           Foreign Address         State       PID/Program name
tcp        0      0 0.0.0.0:111             0.0.0.0:*               LISTEN      381/rpcbind
tcp        0      0 0.0.0.0:80              0.0.0.0:*               LISTEN      9913/nginx: master
tcp        0      0 0.0.0.0:22              0.0.0.0:*               LISTEN      629/sshd
tcp        0      0 127.0.0.1:25            0.0.0.0:*               LISTEN      842/master
tcp        0      0 127.0.0.1:5601          0.0.0.0:*               LISTEN      3094/node
tcp6       0      0 :::111                  :::*                    LISTEN      381/rpcbind
tcp6       0      0 127.0.0.1:9200          :::*                    LISTEN      2778/java
tcp6       0      0 ::1:9200                :::*                    LISTEN      2778/java
tcp6       0      0 :::5044                 :::*                    LISTEN      10183/java
tcp6       0      0 127.0.0.1:9300          :::*                    LISTEN      2778/java
tcp6       0      0 ::1:9300                :::*                    LISTEN      2778/java
tcp6       0      0 :::22                   :::*                    LISTEN      629/sshd
tcp6       0      0 ::1:25                  :::*                    LISTEN      842/master
tcp6       0      0 127.0.0.1:9600          :::*                    LISTEN      10183/java
在上面,我们可以看到两个新增加的端口 9200 及 5044。9200 端口是 Logstash 服务的端口,而 5044 端口是 Logstash 的管道侦听的端口号。我们在下面的章节中使用 Filebeat 向这个端口写入数据,从而把整个数据写入到 Elasticsearch 中。
安装 Filebeat
接下来,我们在 client centos 中安装 Filebeat,并收集该机器的 syslog 文件到 Elasticsearch 中。
我们使用如下的命令来进入到 client 机器中:
ssh root@client$ ssh root@client
The authenticity of host 'client (172.42.42.20)' can't be established.
ECDSA key fingerprint is SHA256:t2cKNprfV1IePIBQjwszqMNiniL/LzjFLA3aaxC63LI.
Are you sure you want to continue connecting (yes/no/[fingerprint])? yes
Warning: Permanently added 'client,172.42.42.20' (ECDSA) to the list of known hosts.
root@client's password:
-bash: warning: setlocale: LC_CTYPE: cannot change locale (UTF-8): No such file or directory
[root@client ~]# 同样的步骤,我们打入 admin 密码。
在这个机器上,我们按照同样的步骤来创建一个 elasticsearch 的 repository:
cat >>/etc/yum.repos.d/elk.repo<<EOF
[ELK-7.x]
name=ELK repository for 7.x packages
baseurl=https://artifacts.elastic.co/packages/7.x/yum
gpgcheck=1
gpgkey=https://artifacts.elastic.co/GPG-KEY-elasticsearch
enabled=1
autorefresh=1
type=rpm-md
EOF
接下来,我们按照如下的步骤来安装 Filebeat:
yum install -y filebeat
等安装完成后,我们需要对 Filebeat 进行一些配置。我们可以通过如下的命令来查看 Filebeat 的配置文件位置:
[root@client ~]# rpm -qc filebeat
/etc/filebeat/filebeat.yml
/etc/filebeat/modules.d/activemq.yml.disabled
/etc/filebeat/modules.d/apache.yml.disabled
/etc/filebeat/modules.d/auditd.yml.disabled
/etc/filebeat/modules.d/aws.yml.disabled
/etc/filebeat/modules.d/awsfargate.yml.disabled
/etc/filebeat/modules.d/azure.yml.disabled
/etc/filebeat/modules.d/barracuda.yml.disabled
/etc/filebeat/modules.d/bluecoat.yml.disabled
/etc/filebeat/modules.d/cef.yml.disabled
/etc/filebeat/modules.d/checkpoint.yml.disabled
/etc/filebeat/modules.d/cisco.yml.disabled
/etc/filebeat/modules.d/coredns.yml.disabled
/etc/filebeat/modules.d/crowdstrike.yml.disabled
/etc/filebeat/modules.d/cyberark.yml.disabled
/etc/filebeat/modules.d/cyberarkpas.yml.disabled
/etc/filebeat/modules.d/cylance.yml.disabled
/etc/filebeat/modules.d/elasticsearch.yml.disabled
/etc/filebeat/modules.d/envoyproxy.yml.disabled
/etc/filebeat/modules.d/f5.yml.disabled
/etc/filebeat/modules.d/fortinet.yml.disabled
/etc/filebeat/modules.d/gcp.yml.disabled
/etc/filebeat/modules.d/google_workspace.yml.disabled
...
在之前的 Logstash 的 beats input 中,我们使用了证书以保证传入数据的安全性。我们需要在 client 的机器中拷贝上面生成的证书:
scp server.example.com:/etc/pki/tls/certs/logstash.crt /etc/pki/tls/certs/[root@client ~]# scp server.example.com:/etc/pki/tls/certs/logstash.crt /etc/pki/tls/certs/
The authenticity of host 'server.example.com (172.42.42.10)' can't be established.
ECDSA key fingerprint is SHA256:T3McRBs+YDcrprJE2FazITq6wmTSutkDqgnuPAQy5O4.
ECDSA key fingerprint is MD5:67:1d:c9:8d:a1:2e:85:fe:5f:fe:20:22:58:91:19:5a.
Are you sure you want to continue connecting (yes/no)? yes
Warning: Permanently added 'server.example.com,172.42.42.10' (ECDSA) to the list of known hosts.
root@server.example.com's password:
logstash.crt 100% 1119 961.5KB/s 00:00
[root@client ~]# ls /etc/pki/tls/certs/
Makefile ca-bundle.trust.crt make-dummy-cert
ca-bundle.crt logstash.crt renew-dummy-cert我们使用如下的命令来修改 Filebeat 的配置文件:
vi /etc/filebeat/filebeat.yml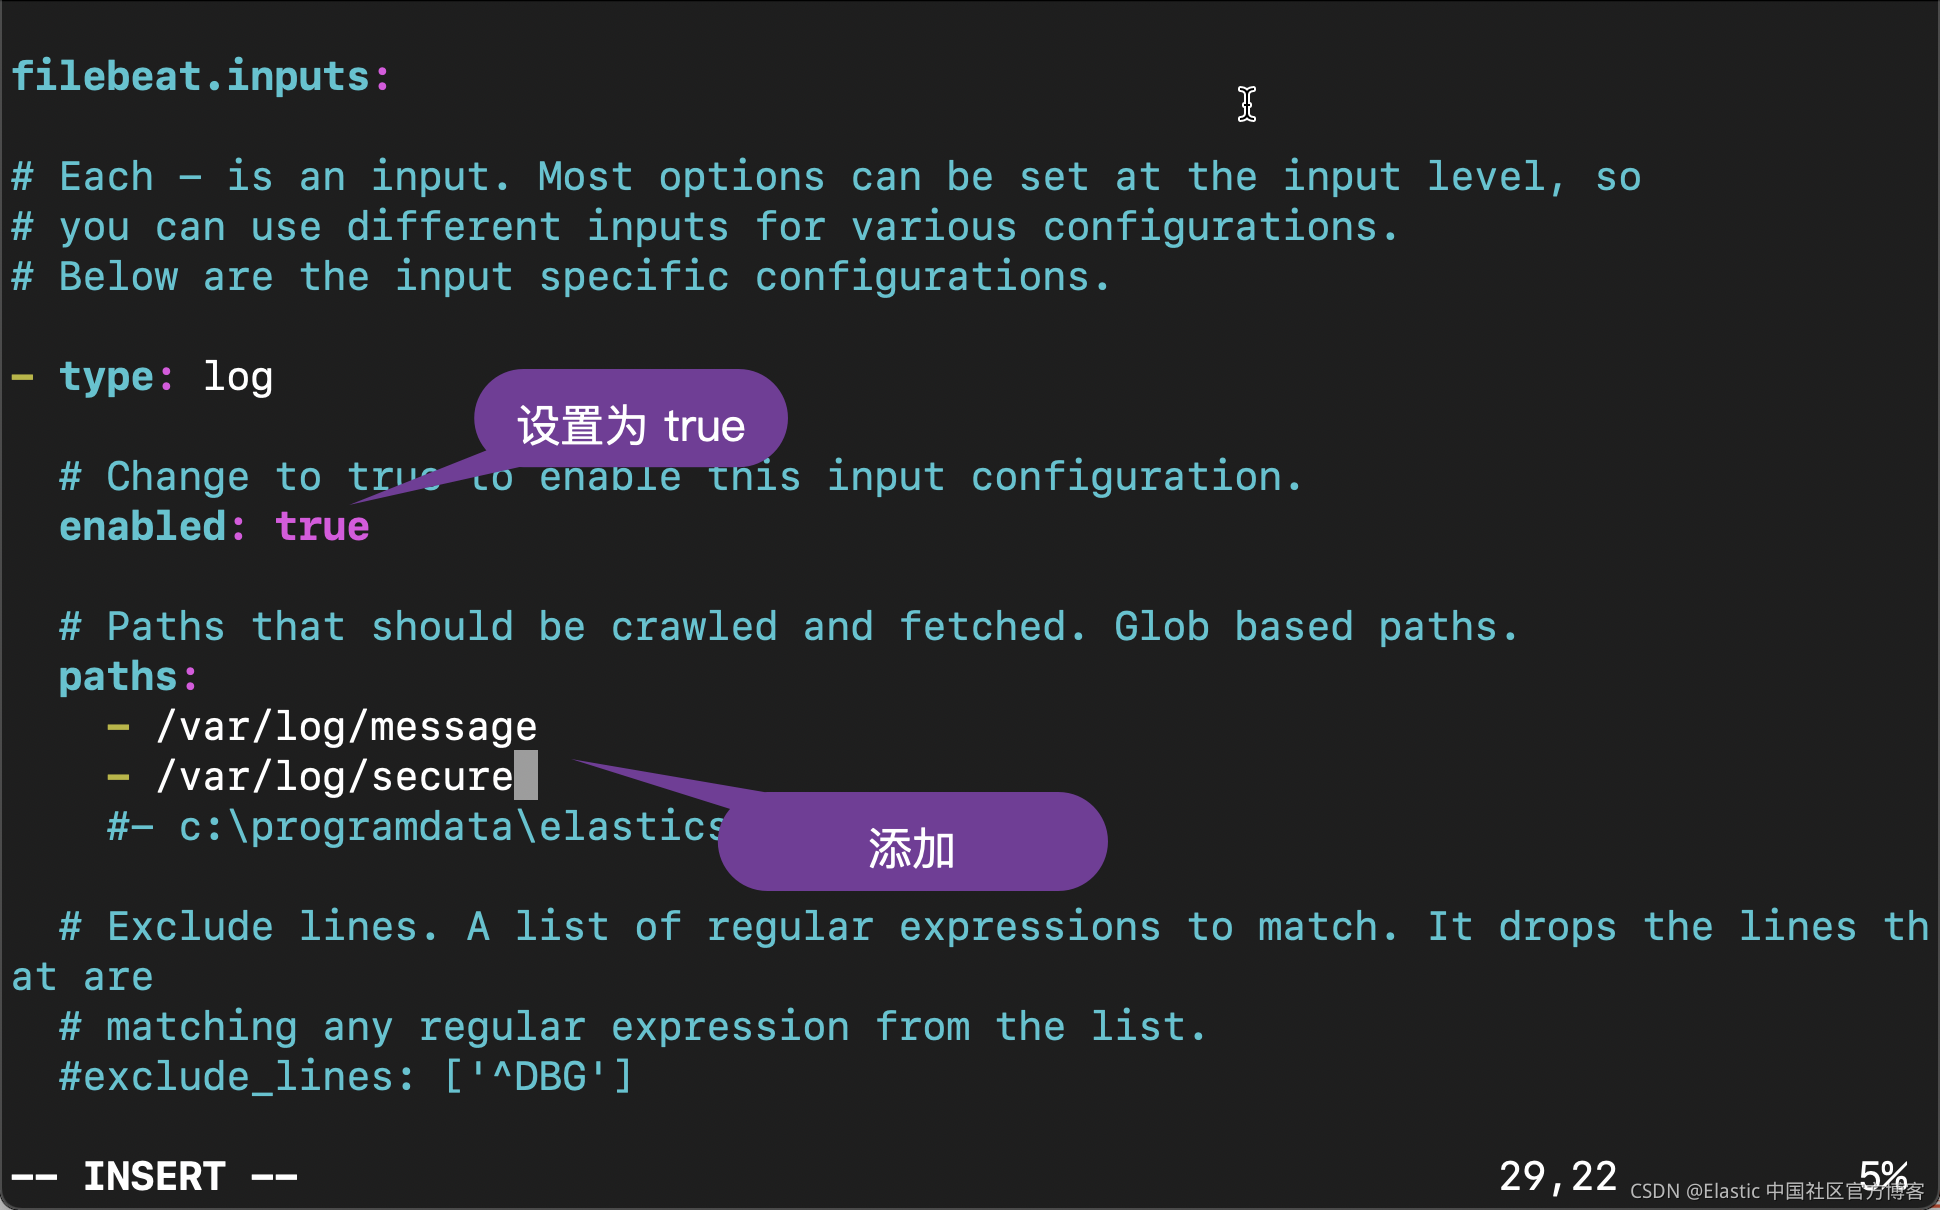
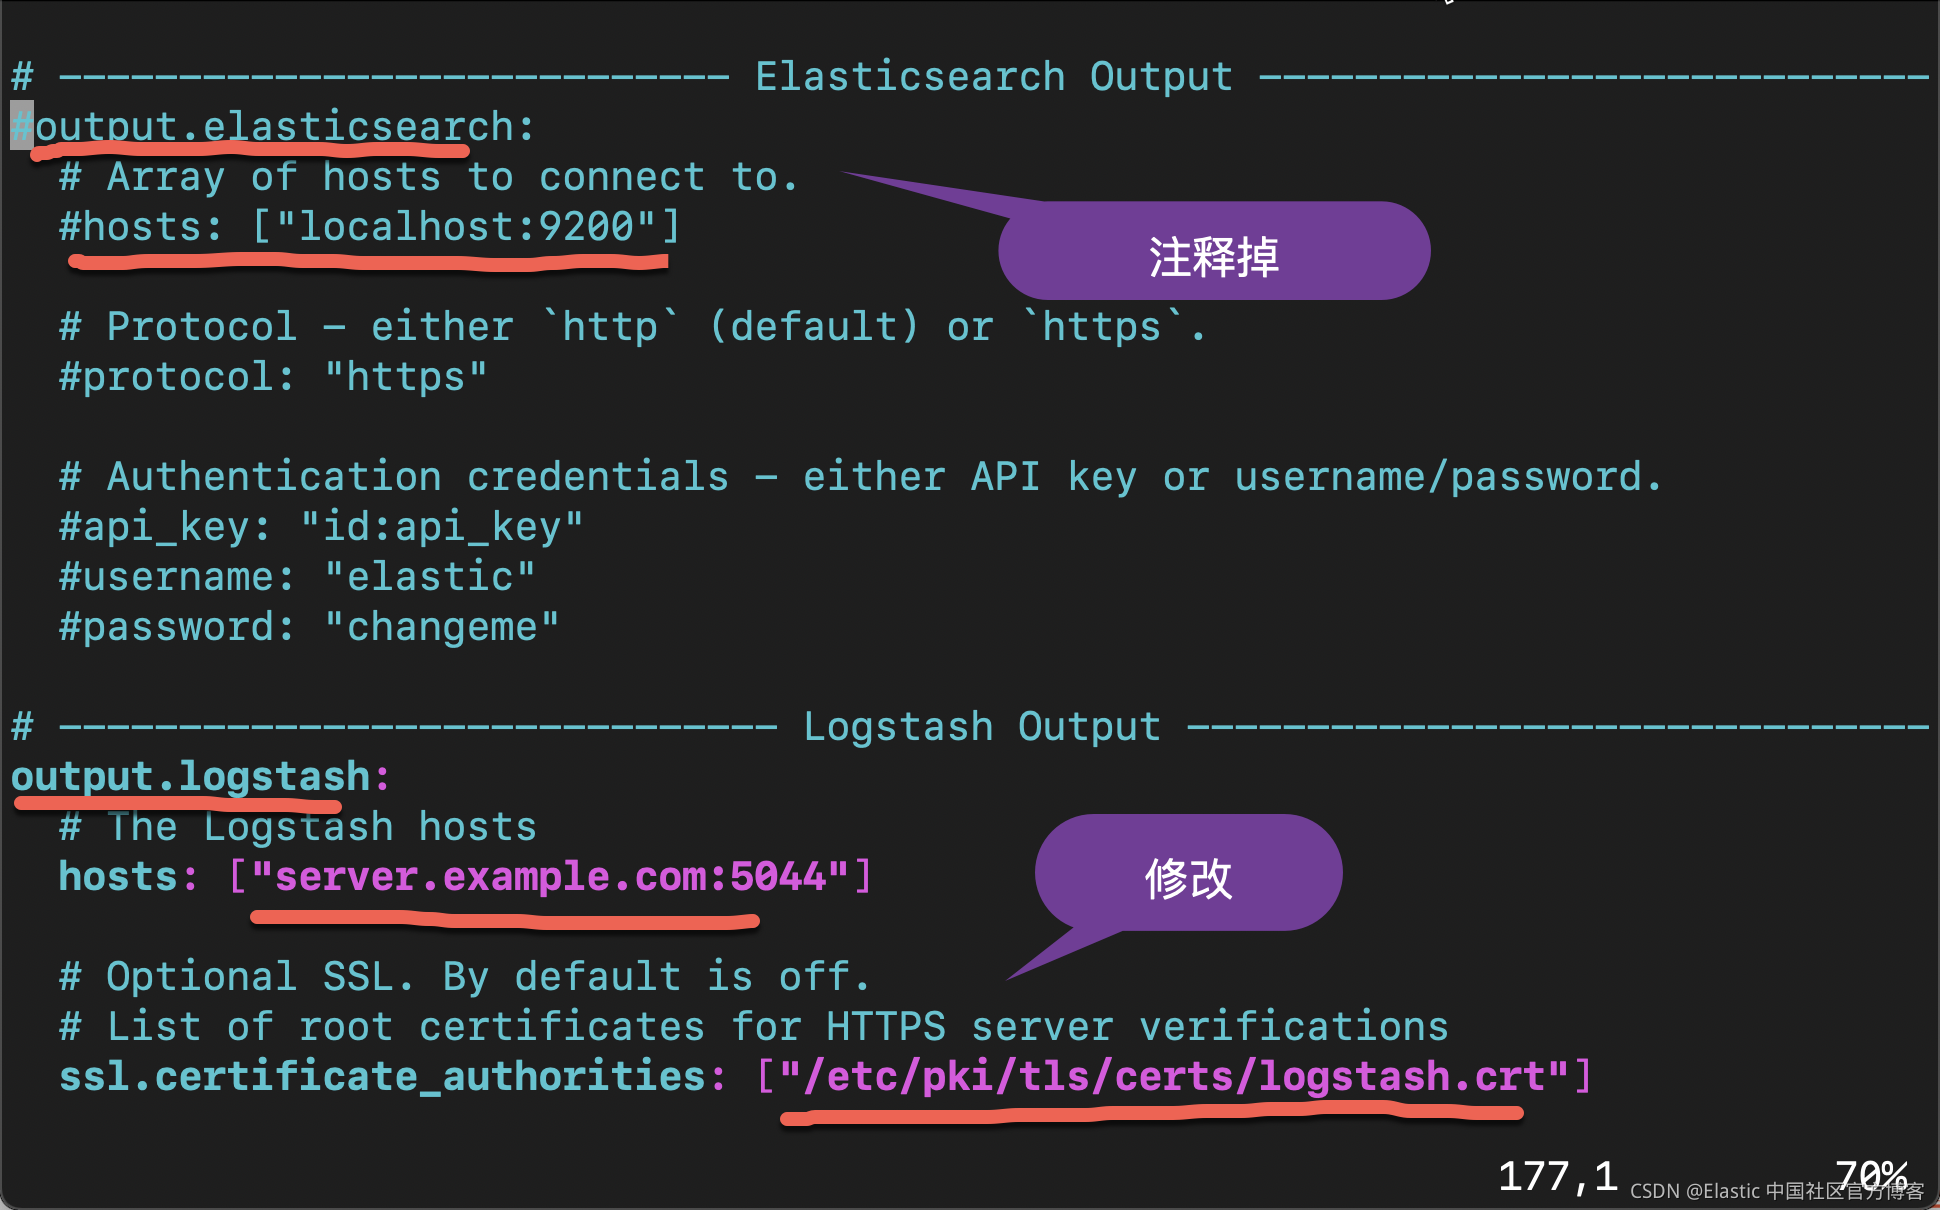
我们在上面指出的部分就像修改,并保存 filebeat.yml 文件。我们可以使用如下的命令来检查我们的配置是否正确:
[root@client ~]# filebeat test config
Config OK
如果你的修改是有问题的,那么上面的结果将不是 OK。
我们接下来启动 Filebeat 服务:
systemctl enable filebeat
systemctl start filebeat
[root@client ~]# systemctl enable filebeat
Created symlink from /etc/systemd/system/multi-user.target.wants/filebeat.service to /usr/lib/systemd/system/filebeat.service.
[root@client ~]# systemctl start filebeat[root@client ~]# journalctl -u filebeat.service
-- Logs begin at Fri 2021-11-19 08:48:20 UTC, end at Sat 2021-11-20 03:58:20 UTC
Nov 20 03:57:20 client.example.com systemd[1]: Started Filebeat sends log files
Nov 20 03:57:20 client.example.com filebeat[3055]: 2021-11-20T03:57:20.136Z
Nov 20 03:57:20 client.example.com filebeat[3055]: 2021-11-20T03:57:20.136Z
Nov 20 03:57:20 client.example.com filebeat[3055]: 2021-11-20T03:57:20.137Z
Nov 20 03:57:20 client.example.com filebeat[3055]: 2021-11-20T03:57:20.137Z
Nov 20 03:57:20 client.example.com filebeat[3055]: 2021-11-20T03:57:20.137Z
Nov 20 03:57:20 client.example.com filebeat[3055]: 2021-11-20T03:57:20.137Z
Nov 20 03:57:20 client.example.com filebeat[3055]: 2021-11-20T03:57:20.138Z
Nov 20 03:57:20 client.example.com filebeat[3055]: 2021-11-20T03:57:20.138Z
Nov 20 03:57:20 client.example.com filebeat[3055]: 2021-11-20T03:57:20.138Z
Nov 20 03:57:20 client.example.com filebeat[3055]: 2021-11-20T03:57:20.138现在我们已经完成了整个 Elastic Stack 的安装了。
检查结果
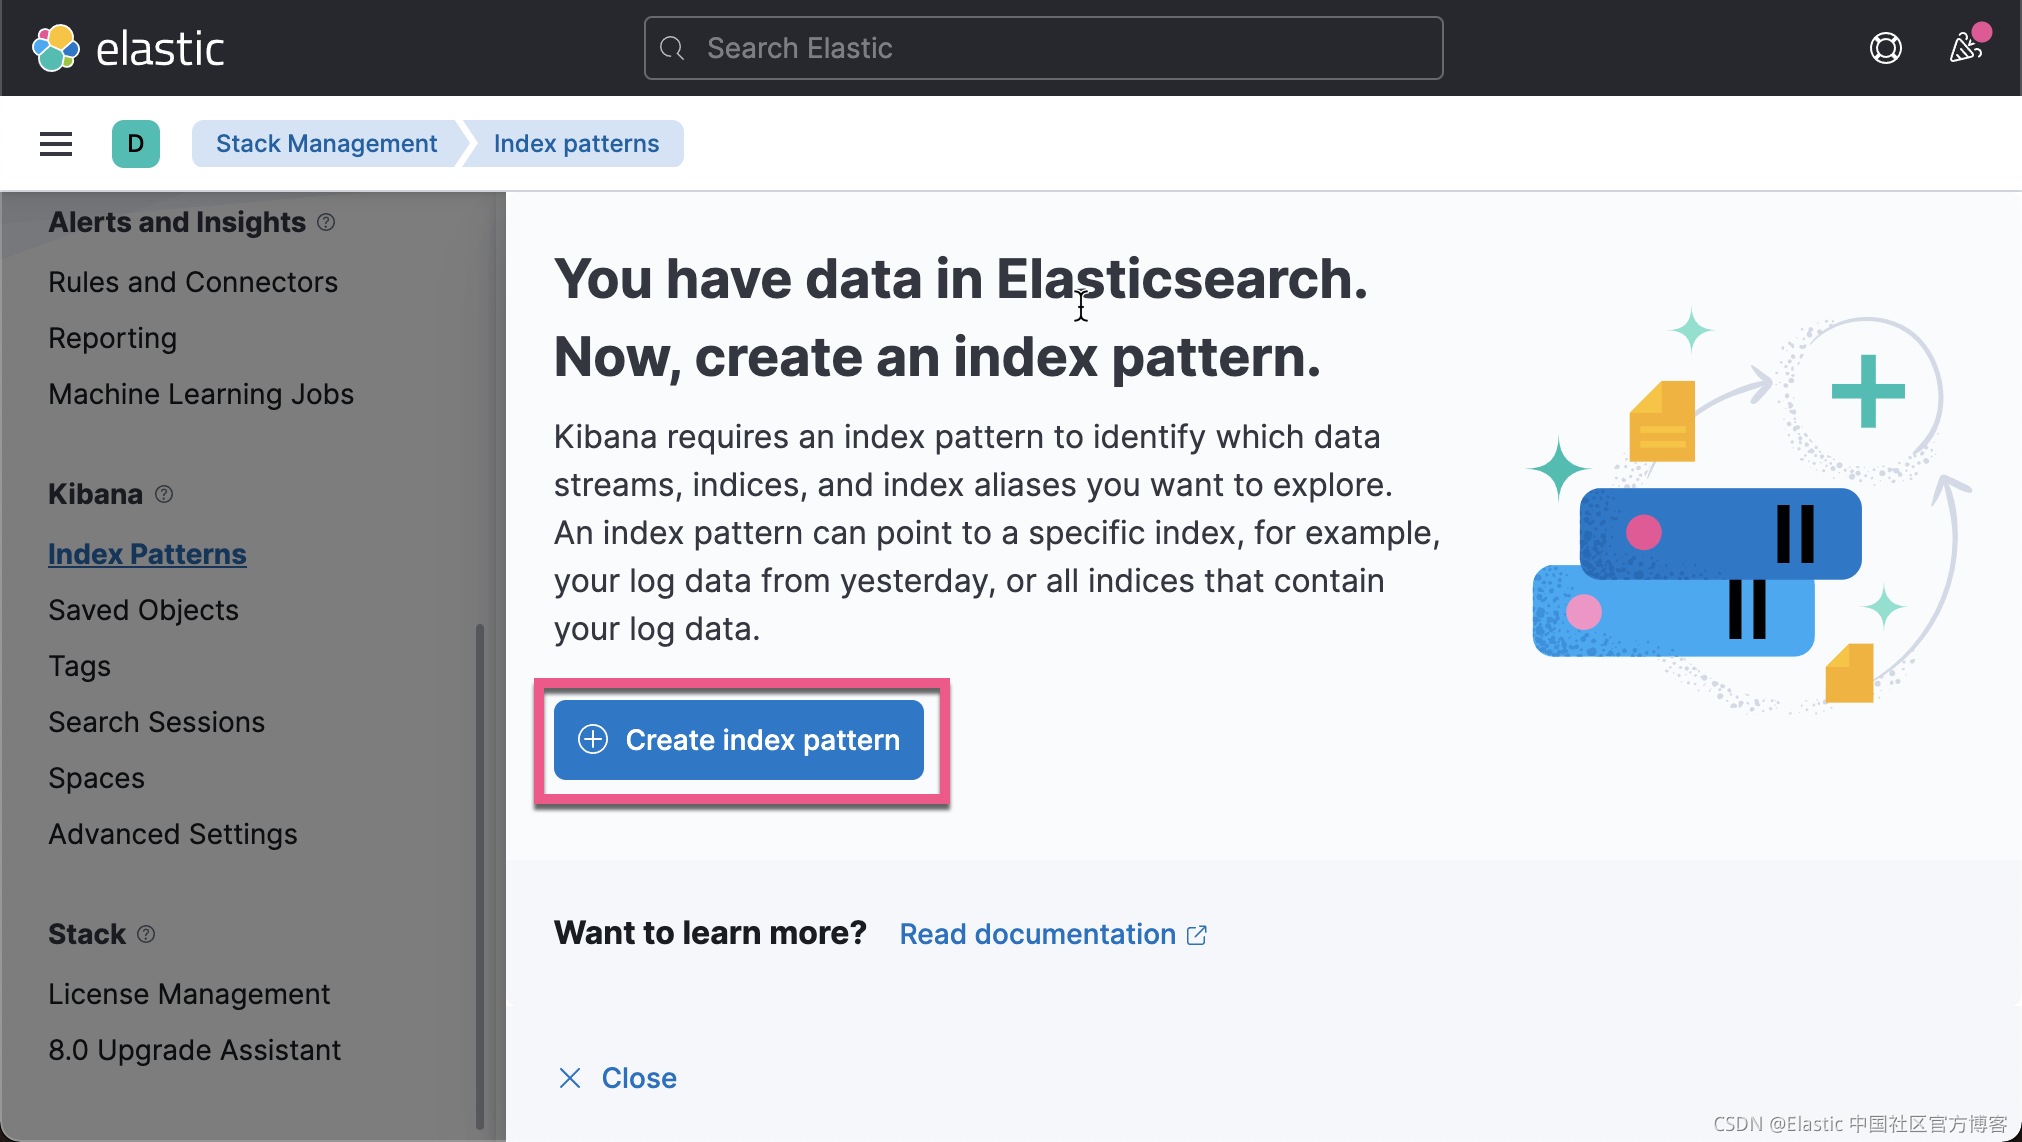
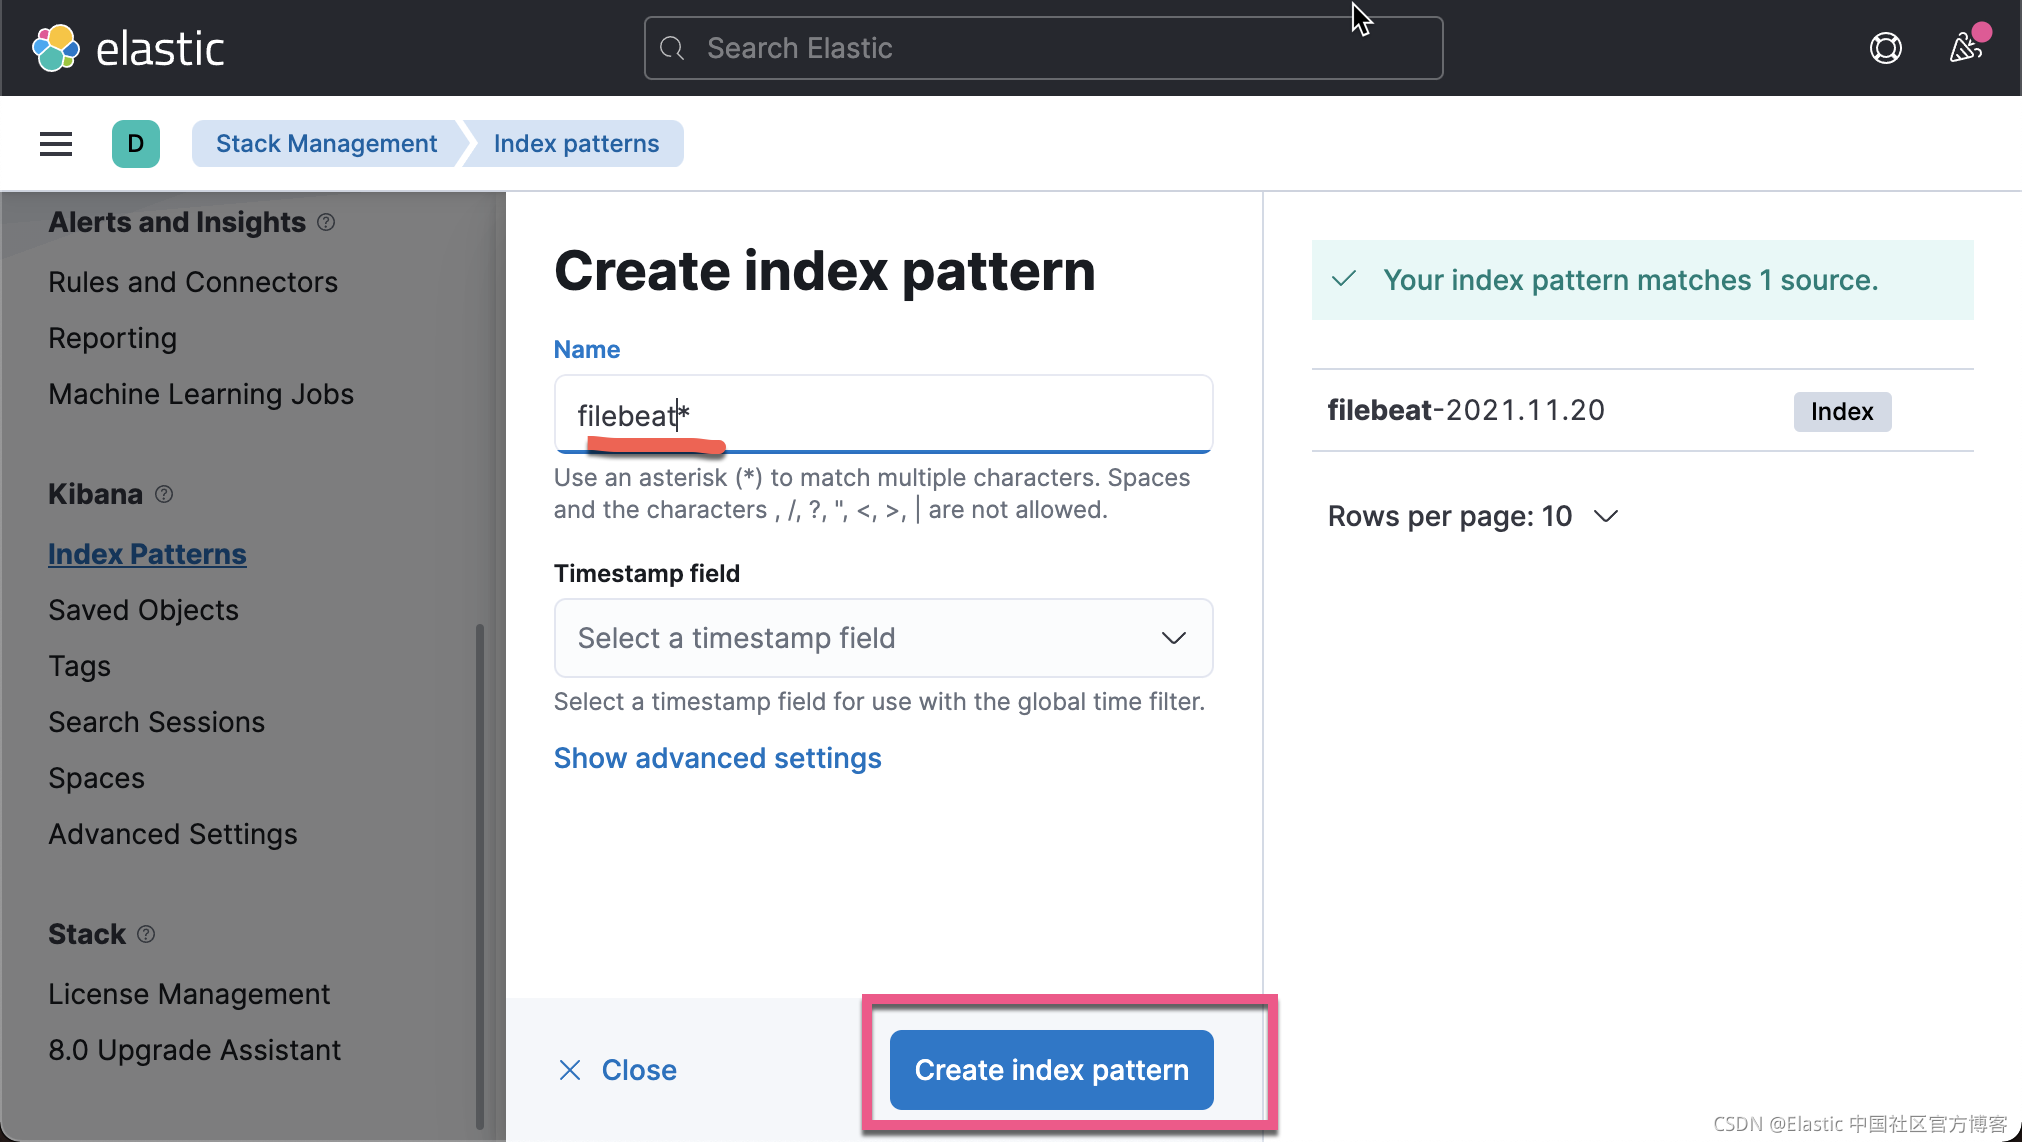
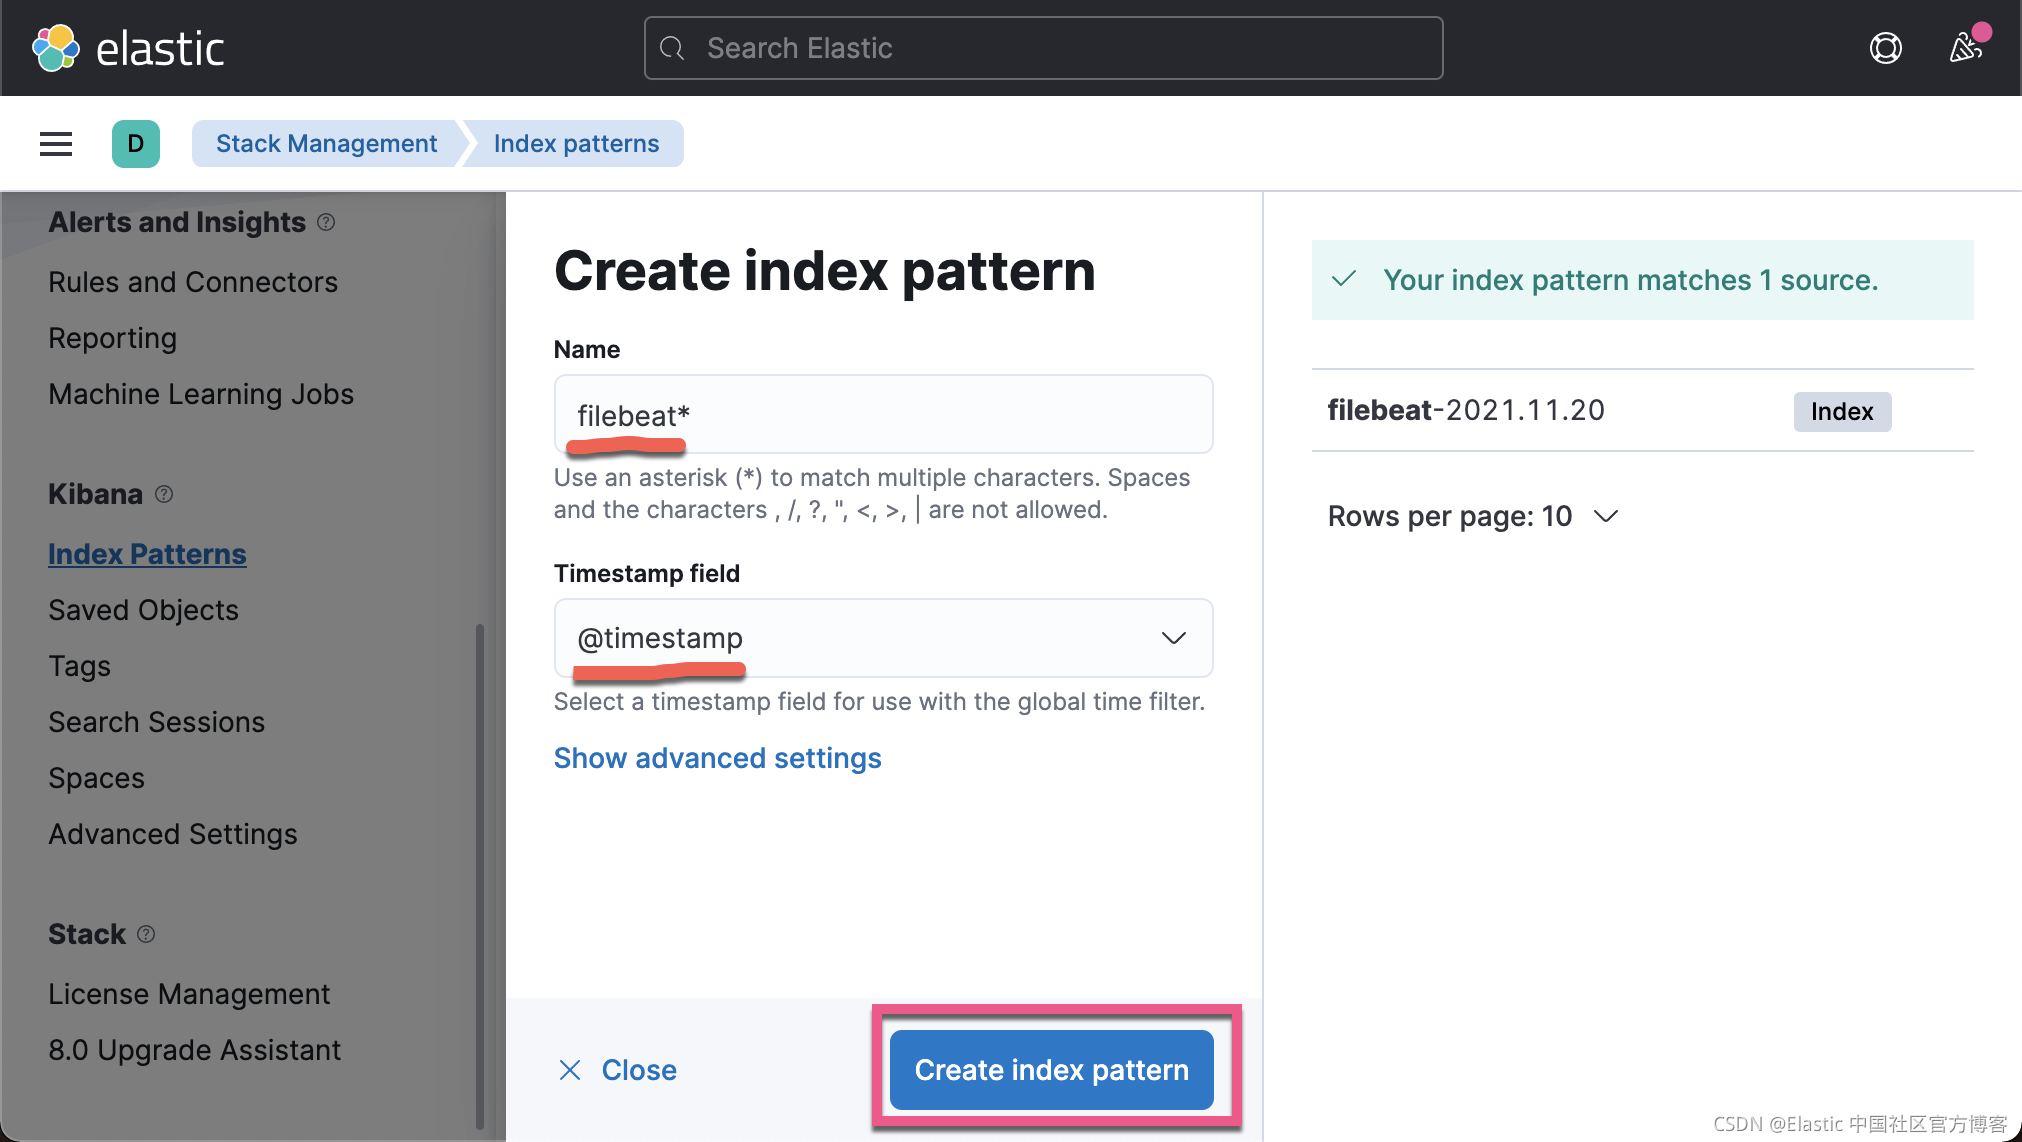
我们在 Kibana 中来查看我们已经收集的文档数据:

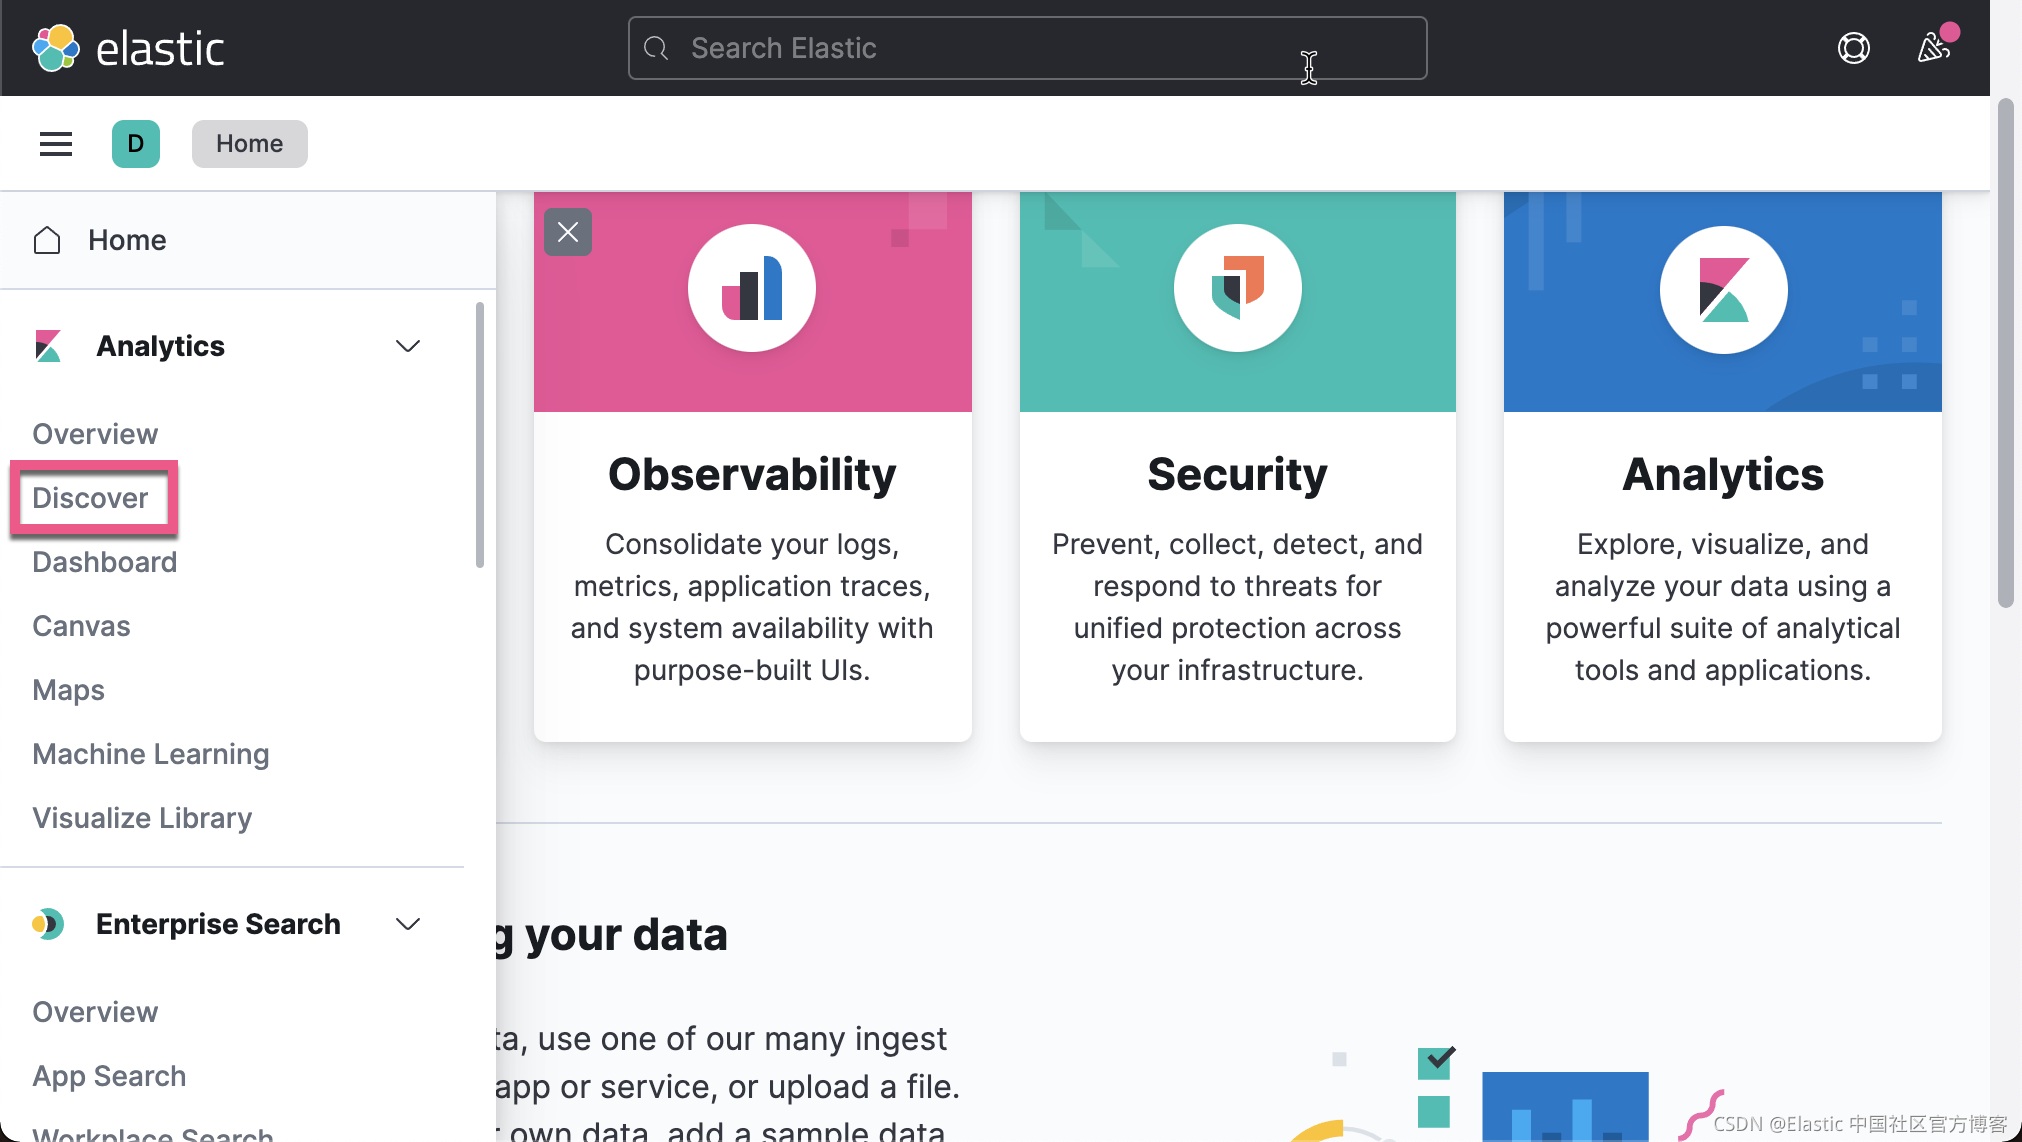
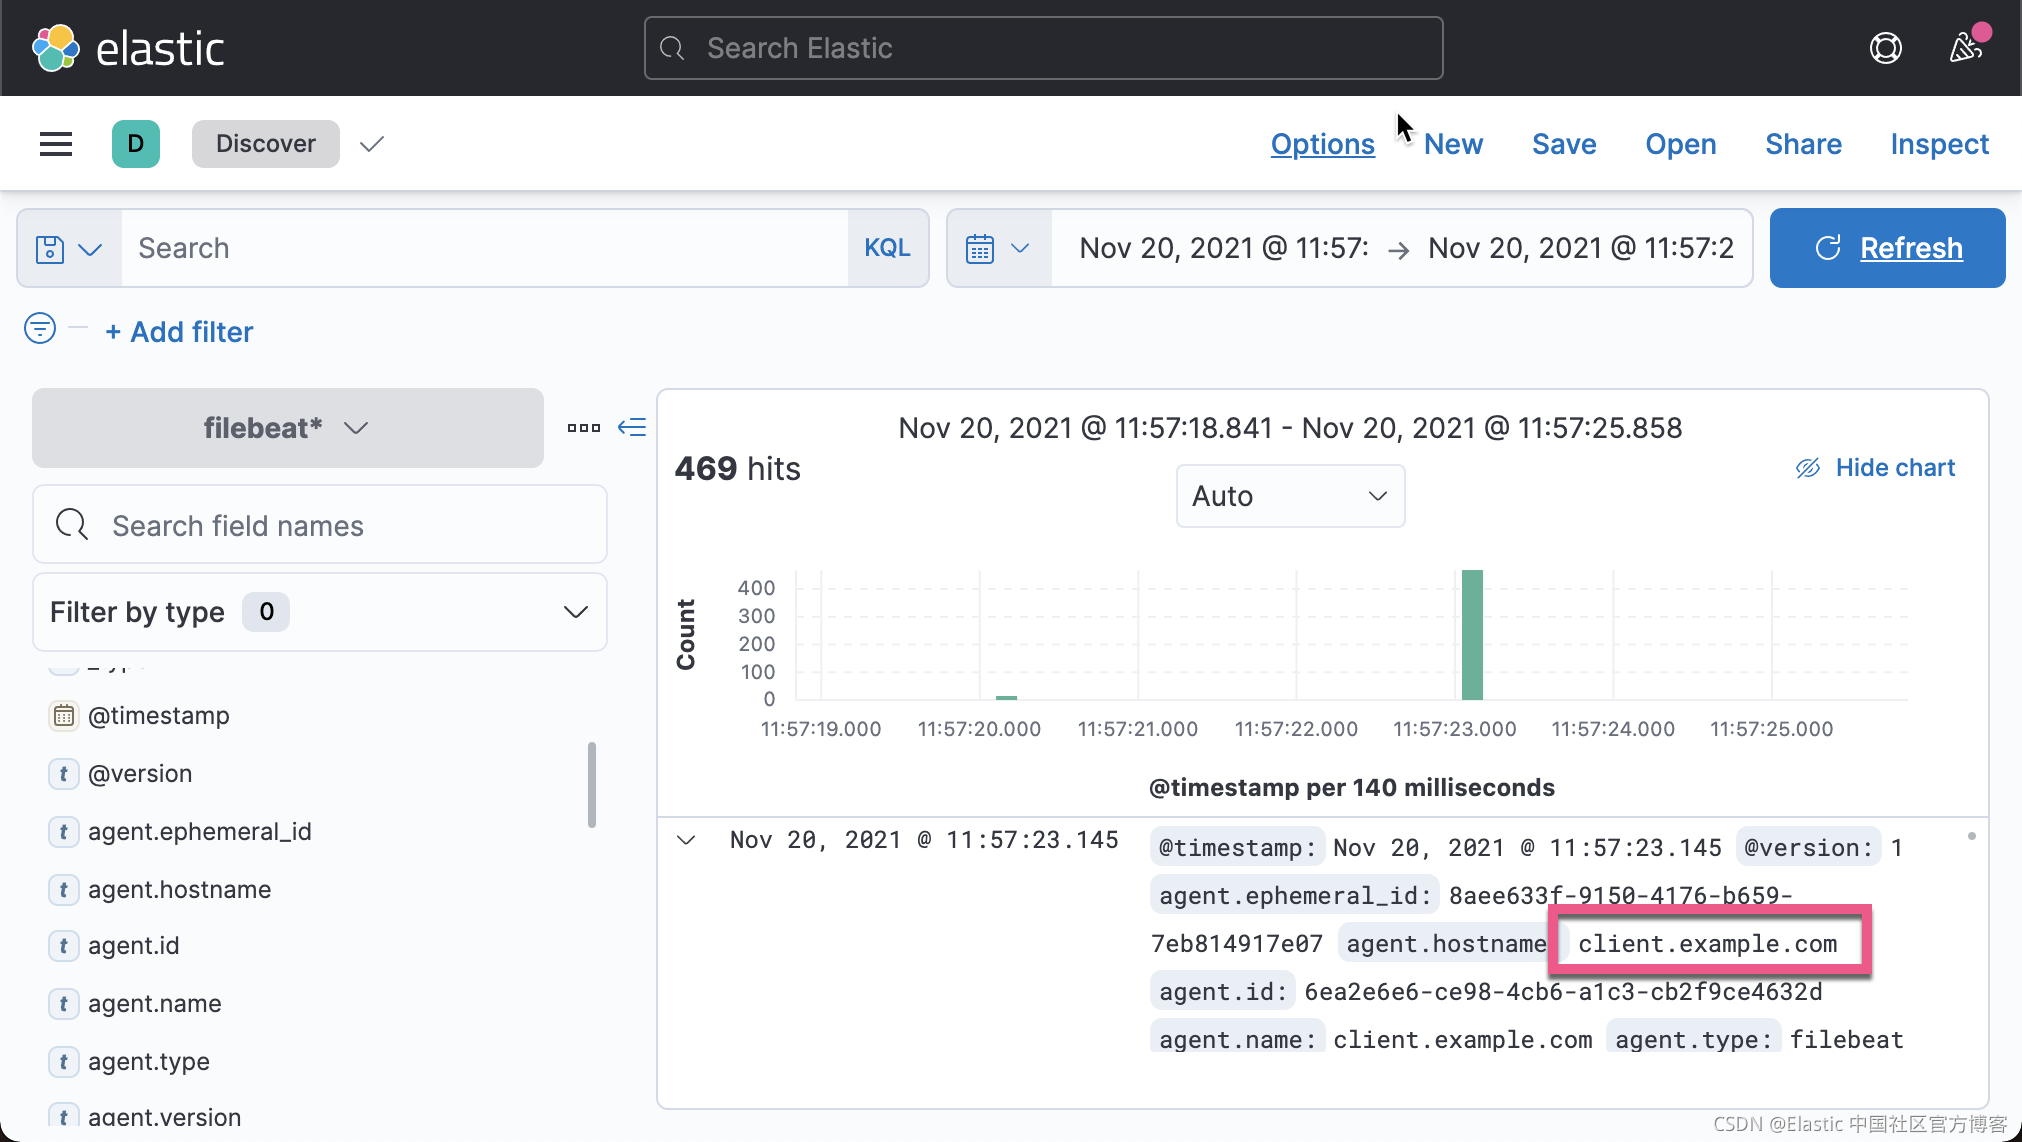
从上面,我们可以看出来收集到的数据来做 client.example.com。
Hooray! 我们终于完成了我们的数据采集。在这整个练习中,我们安装并使用了 Elastic Stack 的 Elasticsearch,Kibana, Logstash 及 Filebeat。
登录后可发表评论
点击登录