OpenCV-Python实战(番外篇)——OpenCV、NumPy和Matplotlib直方图比较
- 前言
- OpenCV、NumPy和Matplotlib灰度直方图比较
- OpenCV、NumPy和Matplotlib颜色直方图比较
- 相关链接
前言
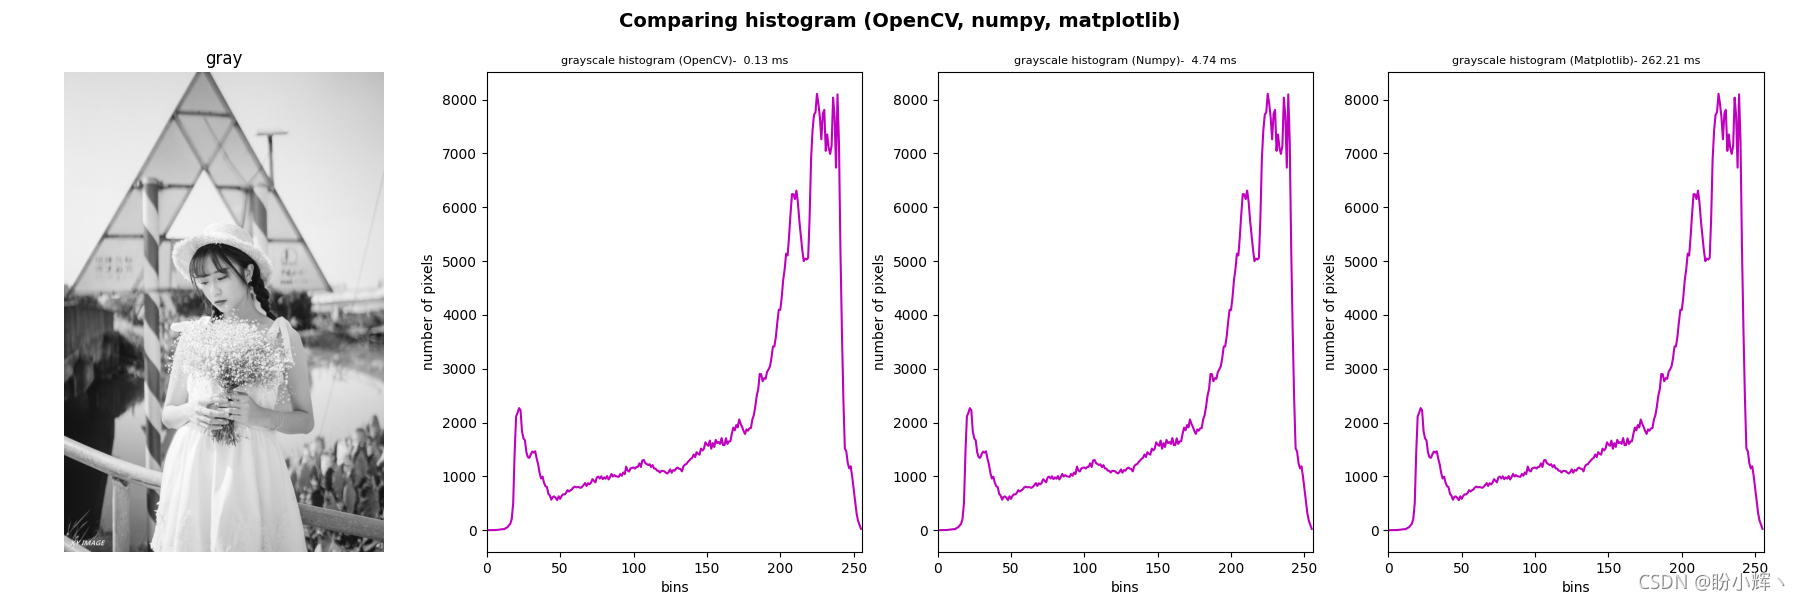
在《OpenCV-Python实战(7)——直方图详解(❤️万字长文,含大量示例❤️)》中,我们学习了使用 OpenCV 提供的 cv2.calcHist() 函数来计算直方图。此外,NumPy 和 Matplotlib 同样也为创建直方图提供了类似的函数。出于提高性能目的,我们来比较这些函数,使用 OpenCV、NumPy 和 Matplotlib 创建直方图,然后测量每个直方图计算的执行时间并将结果绘制在图形中。
OpenCV、NumPy和Matplotlib灰度直方图比较
使用 timeit.default_timer 测量执行时间,因为它会自动提供系统平台和 Python 版本上可用的最佳时钟,首先将其导入:
from timeit import default_timer as timer
可以使用以下方法计算程序的执行时间:
start = timer()
# 程序执行
end = timer()
execution_time = start - end
考虑到 default_timer() 测量值可能会受到同时运行的其他程序的影响。因此,获取准确计时的最佳方法是重复数次并使用最佳时间。
而为了计算和比较直方图,我们需要使用以下函数:
OpenCV提供cv2.calcHist()函数NumPy提供的np.histogram()函数Matplotlib提供的plt.hist()函数
用于计算上述每个函数的执行时间的代码如下:
import numpy as np
import cv2
from matplotlib import pyplot as plt
from timeit import default_timer as timer


def show_img_with_matplotlib(color_img, title, pos):
    img_RGB = color_img[:, :, ::-1]

    ax = plt.subplot(1, 4, pos)
    plt.imshow(img_RGB)
    plt.title(title)
    plt.axis('off')

def show_hist_with_matplotlib_gray(hist, title, pos, color):
    ax = plt.subplot(1, 4, pos)
    plt.title(title)
    plt.xlabel("bins")
    plt.ylabel("number of pixels")
    plt.xlim([0, 256])
    plt.plot(hist, color=color)


plt.figure(figsize=(18, 6))
plt.suptitle("Comparing histogram (OpenCV, numpy, matplotlib)", fontsize=14, fontweight='bold')

image = cv2.imread('example.png')
gray_image = cv2.cvtColor(image, cv2.COLOR_BGR2GRAY)

# 计算 cv2.calcHist() 执行时间
start = timer()
hist = cv2.calcHist([gray_image], [0], None, [256], [0, 256])
end = timer()
# 乘以1000将单位转换为毫秒
exec_time_calc_hist = (end - start) * 1000

# 计算 np.histogram() 执行时间
start = timer()
hist_np, bin_np = np.histogram(gray_image.ravel(), 256, [0, 256])
end = timer()
exec_time_np_hist = (end - start) * 1000

# 计算 plt.hist() 执行时间
start = timer()
# 调用 plt.hist() 计算直方图
(n, bins, patches) = plt.hist(gray_image.ravel(), 256, [0, 256])
end = timer()
exec_time_plt_hist = (end - start) * 1000

# 绘制灰度图及其直方图
how_img_with_matplotlib(cv2.cvtColor(gray_image, cv2.COLOR_GRAY2BGR), "gray", 1)
show_hist_with_matplotlib_gray(hist, "grayscale histogram (OpenCV)-" + str('% 6.2f ms' % exec_time_calc_hist), 2, 'm')
show_hist_with_matplotlib_gray(hist_np, "grayscale histogram (Numpy)-" + str('% 6.2f ms' % exec_time_np_hist), 3, 'm')
show_hist_with_matplotlib_gray(n, "grayscale histogram (Matplotlib)-" + str('% 6.2f ms' % exec_time_plt_hist), 4, 'm')

plt.show()

OpenCV、NumPy和Matplotlib颜色直方图比较
对比颜色直方图的方法与灰度直方图类似:
import numpy as np
import cv2
from matplotlib import pyplot as plt
from timeit import default_timer as timer


def show_img_with_matplotlib(color_img, title, pos):
    img_RGB = color_img[:, :, ::-1]

    ax = plt.subplot(1, 4, pos)
    plt.imshow(img_RGB)
    plt.title(title)
    plt.axis('off')

def show_hist_with_matplotlib_rgb(hist, title, pos, color):
    ax = plt.subplot(1, 4, pos)
    plt.title(title)
    plt.xlabel("bins")
    plt.ylabel("number of pixels")
    plt.xlim([0, 256])

    for (h, c) in zip(hist, color):
        plt.plot(h, color=c)

plt.figure(figsize=(18, 6))
plt.suptitle("Comparing histogram (OpenCV, numpy, matplotlib)", fontsize=14, fontweight='bold')

image = cv2.imread('example.png')

# 计算 cv2.calcHist() 执行时间
start = timer()
def hist_color_img(img):
    histr = []
    histr.append(cv2.calcHist([img], [0], None, [256], [0, 256]))
    histr.append(cv2.calcHist([img], [1], None, [256], [0, 256]))
    histr.append(cv2.calcHist([img], [2], None, [256], [0, 256]))
    return histr

hist= hist_color_img(image)
end = timer()
exec_time_calc_hist = (end - start) * 1000

# 计算 np.histogram() 执行时间
start = timer()
def hist_color_img_np(img):
    histr = []
    hist_np, bin_np = np.histogram(img[:,:,0].ravel(), 256, [0, 256])
    histr.append(hist_np)
    hist_np, bin_np = np.histogram(img[:,:,1].ravel(), 256, [0, 256])
    histr.append(hist_np)
    hist_np, bin_np = np.histogram(img[:,:,2].ravel(), 256, [0, 256])
    histr.append(hist_np)
    return histr
hist_np = hist_color_img_np(image)
end = timer()
exec_time_np_hist = (end - start) * 1000

# 计算 plt.hist 执行时间
start = timer()
def hist_color_img_plt(img):
    histr = []
    (n, bins, patches) = plt.hist(image[:,:,0].ravel(), 256, [0, 256])
    histr.append(n)
    (n, bins, patches) = plt.hist(image[:,:,1].ravel(), 256, [0, 256])
    histr.append(n)
    (n, bins, patches) = plt.hist(image[:,:,2].ravel(), 256, [0, 256])
    histr.append(n)
    return histr
n = hist_color_img_plt(image)
end = timer()
exec_time_plt_hist = (end - start) * 1000

# 绘制图像及其颜色直方图
show_img_with_matplotlib(image, "color", 1)
show_hist_with_matplotlib_rgb(hist, "color histogram (OpenCV)-" + str('% 6.2f ms' % exec_time_calc_hist), 2, ['b', 'g', 'r'])
show_hist_with_matplotlib_rgb(hist_np, "color histogram (Numpy)-" + str('% 6.2f ms' % exec_time_np_hist), 3, ['b', 'g', 'r'])
show_hist_with_matplotlib_rgb(n, "color histogram (Matplotlib)-" + str('% 6.2f ms' % exec_time_plt_hist), 4, ['b', 'g', 'r'])

plt.show()

由上面两个实例可以看出,cv2.calcHist() 的执行速度比 np.histogram() 和 plt.hist() 都快。因此,出于性能考虑,在计算图像直方图时可以使用 OpenCV 函数。
相关链接
《OpenCV-Python实战(7)——直方图详解(❤️万字长文,含大量示例❤️)》