上课的时候的一个实验,闲得无聊把3维的线性回归矩阵化,以便以后可以对几百几千维的数据也可以使用该算法(虽然直接sklearn更快),但毕竟是手搓出来的用起来好玩一点点。
线性回归原理如下(原理很简单,字是鬼画符,不看也罢):
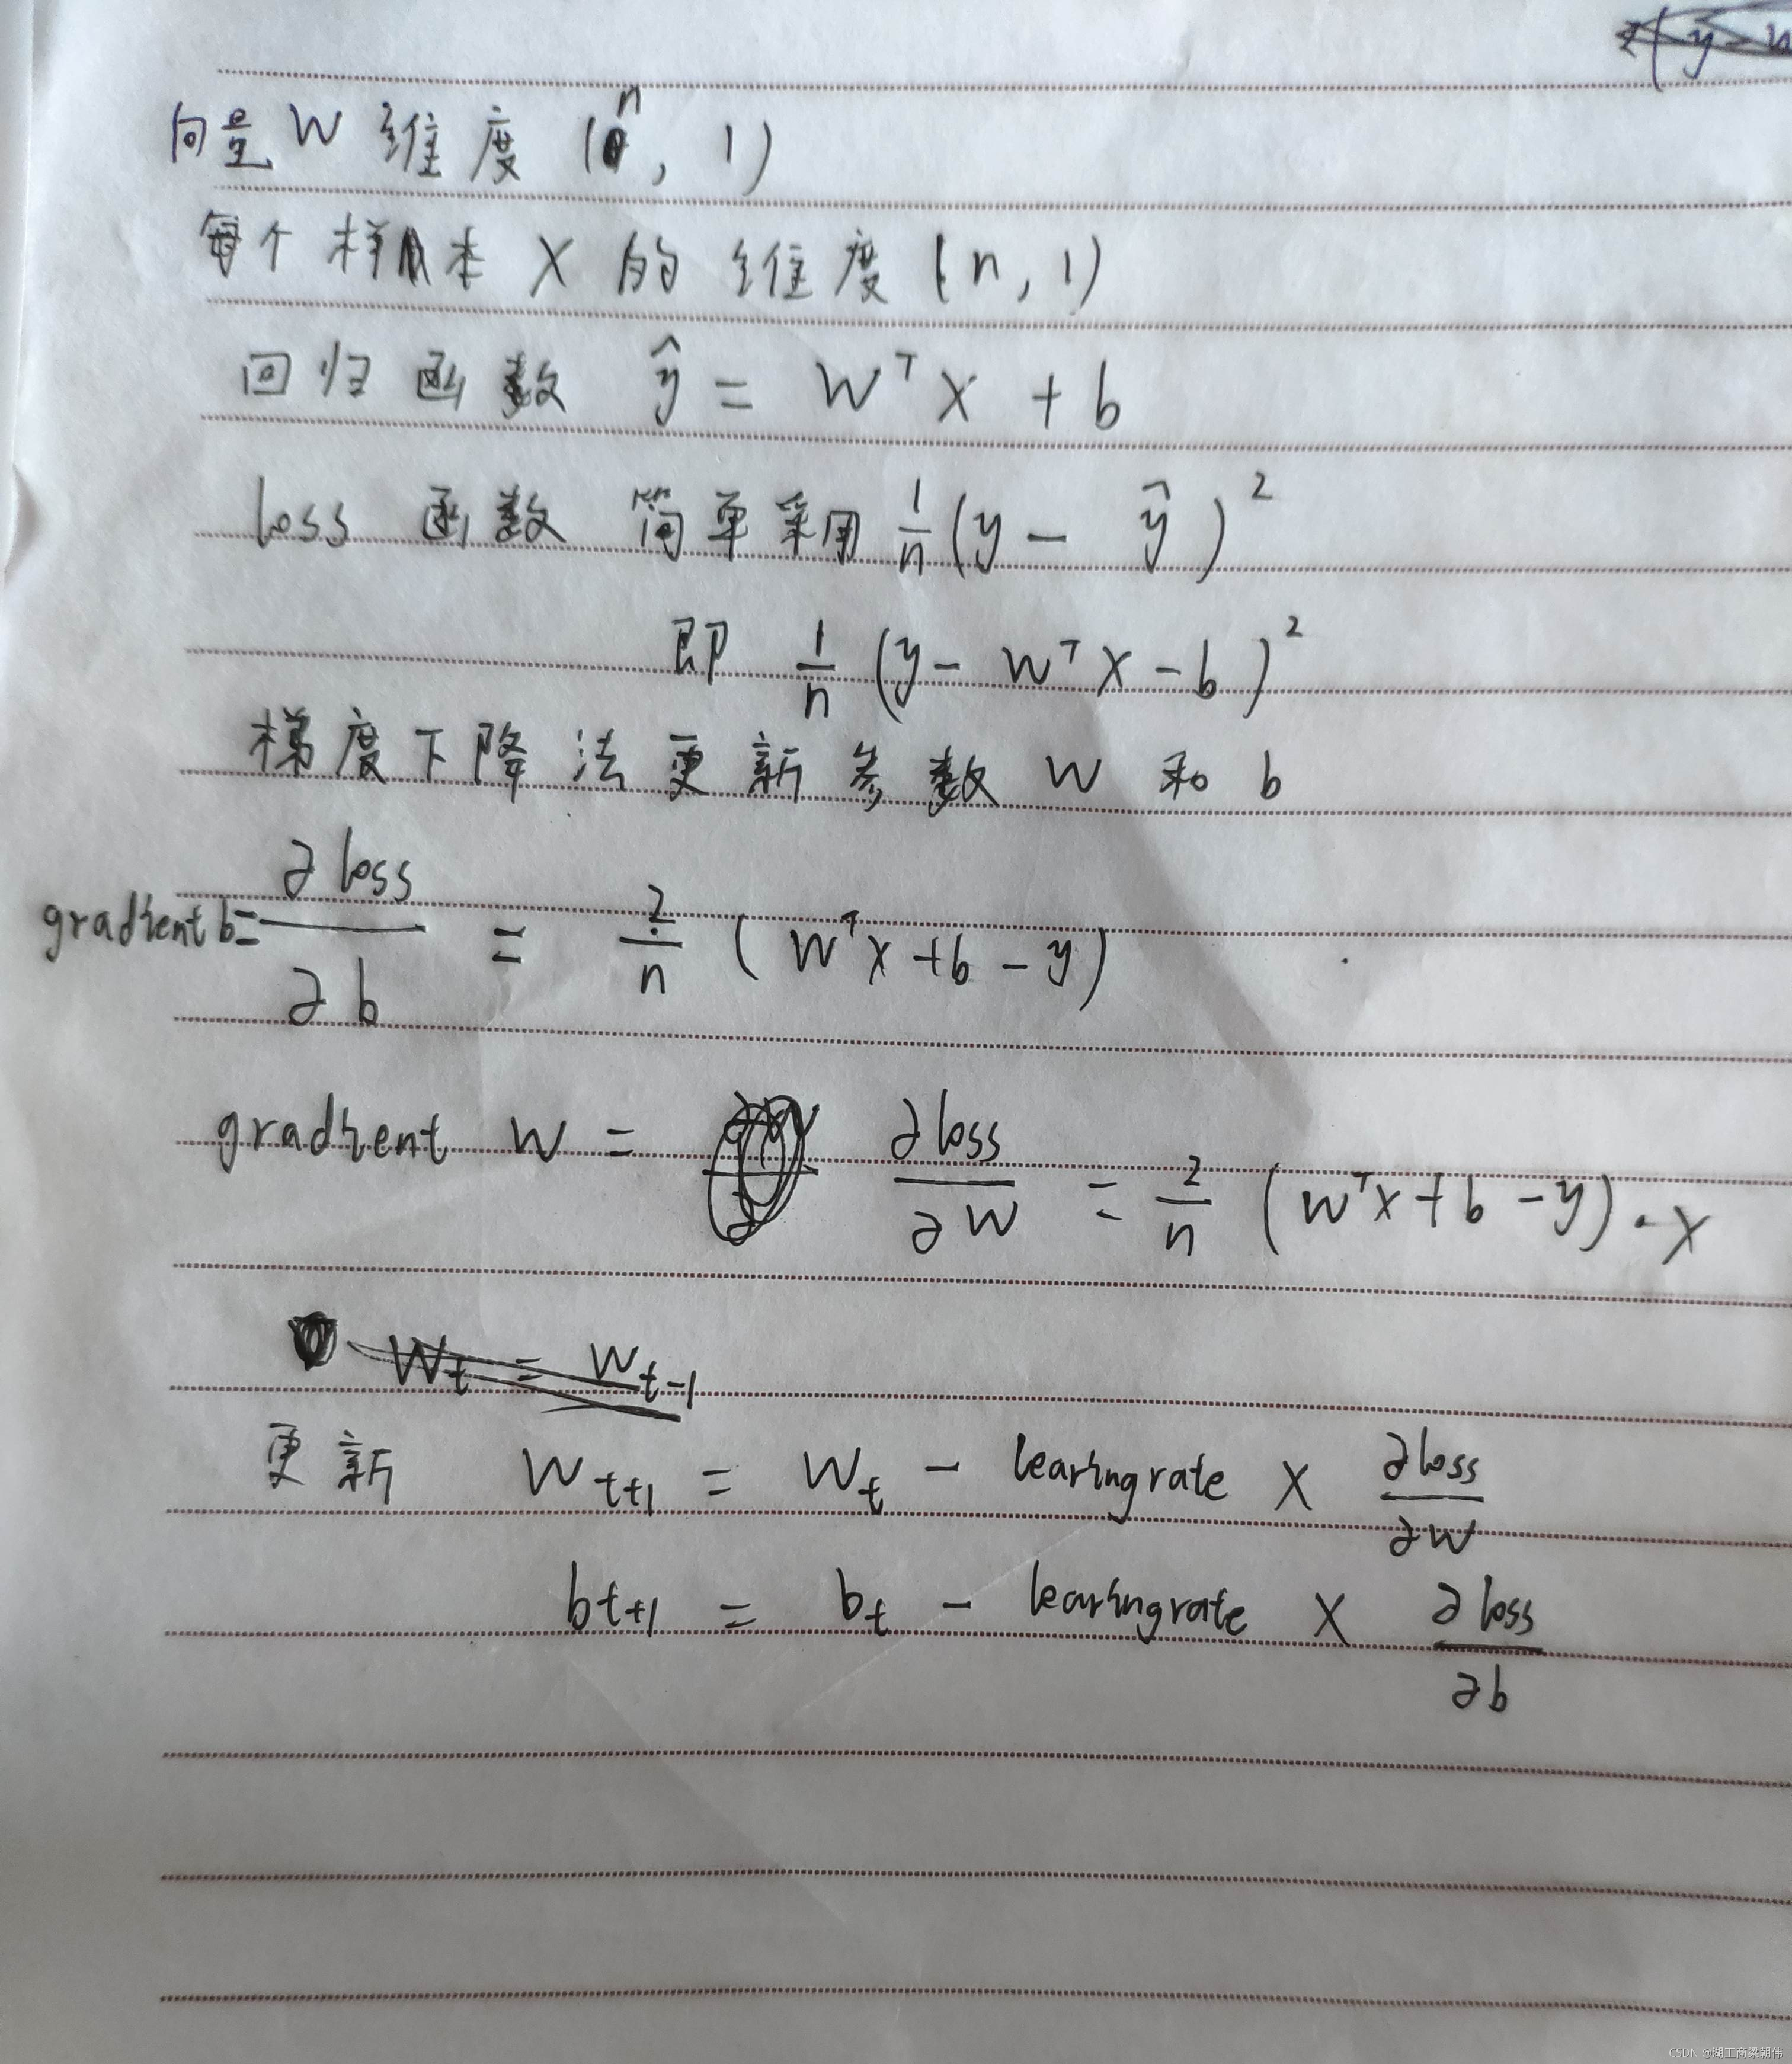
注:这里只是回归,不是分类。多分类的问题的话需要训练多组参数W和b,用softmax进行分类,其结构就类似没有隐藏层只有输出层的神经网络。这里就懒得弄了。
鸢尾花数据集链接如下:
链接:https://pan.baidu.com/s/1Lm5oKDfnnFGvWycuF9D1PA
提取码:1234
具体代码如下,注释有详细介绍:
import numpy as np
import matplotlib.pyplot as plt
import pandas as pd
from sklearn.preprocessing import LabelEncoder  # 处理鸢尾花数据的


def compute_error(b, W, points):
    '''
    计算损失,这里采用简单的(y-y^hat)**2这一损失函数
    :param b: 偏差b,一个标量,
    :param W: 形状是(n, 1),对应鸢尾花数据集的话是(4, 1)
    :param points:
    :return:
    '''
    total_error = 0
    # 遍历每一个数据集,计算总损失
    for i in range(0, len(points)):
        X = points[i:i + 1, 0:4].T  # X的维度是(4, 1)
        y = points[i, 4]

        total_error += (y - (np.dot(W.T, X)[0, 0]+b))**2
    # 平均损失
    return total_error / float(len(points))

def gradient(b_current, W_current, points, learning_rate):
    '''
    梯度下降算法
    :param b_current: 上一步的b
    :param W_current: 上一步的W,形状是(4, 1)
    :param points: 传入的数据集矩阵
    :param learning_rate: 学习率
    :return:new_b, new_W
    '''
    b_gradient = 0
    W_gradient = np.zeros((4, 1))
    cnt = float(len(points))

    for i in range(0, len(points)):
        X = points[i:i+1, 0:-1].T  # shape: (4, 1)
        y = points[i, -1]  # y是个标量
        # 损失函数(y-y^hat)**2对标量b和向量W求偏导得它们的梯度
        b_gradient += (2 / cnt) * ((np.dot(W_current.T, X)[0, 0] + b_current) - y)
        W_gradient += (2 / cnt) * ((np.dot(W_current.T, X)[0, 0]+b_current)-y) * X

    # 梯度下降发更新参数
    new_W = W_current - (learning_rate * W_gradient)
    new_b = b_current - (learning_rate * b_gradient)

    return new_b, new_W

def lr(points, starting_b, starting_W, learning_rate, num_iterations):
    '''
    线性回归模型
    :param points:
    :param starting_b: 1个标量
    :param starting_W: W参数向量,这里shape是(4, 1)
    :param learning_rate:学习率
    :param num_iterations:迭代次数
    :return:
    '''
    b = starting_b
    W = starting_W
    # update for several times
    for i in range(num_iterations):
        b, W = gradient(b, W, np.array(points), learning_rate)
        print('第{}次 损失:{}'.format(i+1, compute_error(b, W, points)))
    return b, W


def main():
    # 处理数据
    df_data = pd.read_csv('Iris.csv')
    non_numeric_features = ["Species"]
    for feature in non_numeric_features:
        df_data[feature] = LabelEncoder().fit_transform(df_data[feature])

    x = df_data.iloc[:, 1:5]
    y = df_data.iloc[:, 5:]
    print(type(x))
    points = np.hstack((x, y))  # points是鸢尾花数据集,其shape:(n, 5),最后一列是标签y
    # print(points)

    x_shape = points[:, :-1].shape  # (n, 特征数),这里是(n, 4)
    learning_rate = 0.001
    initial_b = 2  # 初始化b参数shape (4, 1)
    initial_W = np.zeros((x_shape[1], 1))  # 初始化W参数shape (4, 1)
    num_iterations = 1000

    print("Running...")
    b, W = lr(points, initial_b, initial_W, learning_rate, num_iterations)
    print('最终损失:{}'.format(compute_error(b, W, points)))


if __name__ == '__main__':
    main()
OKK!