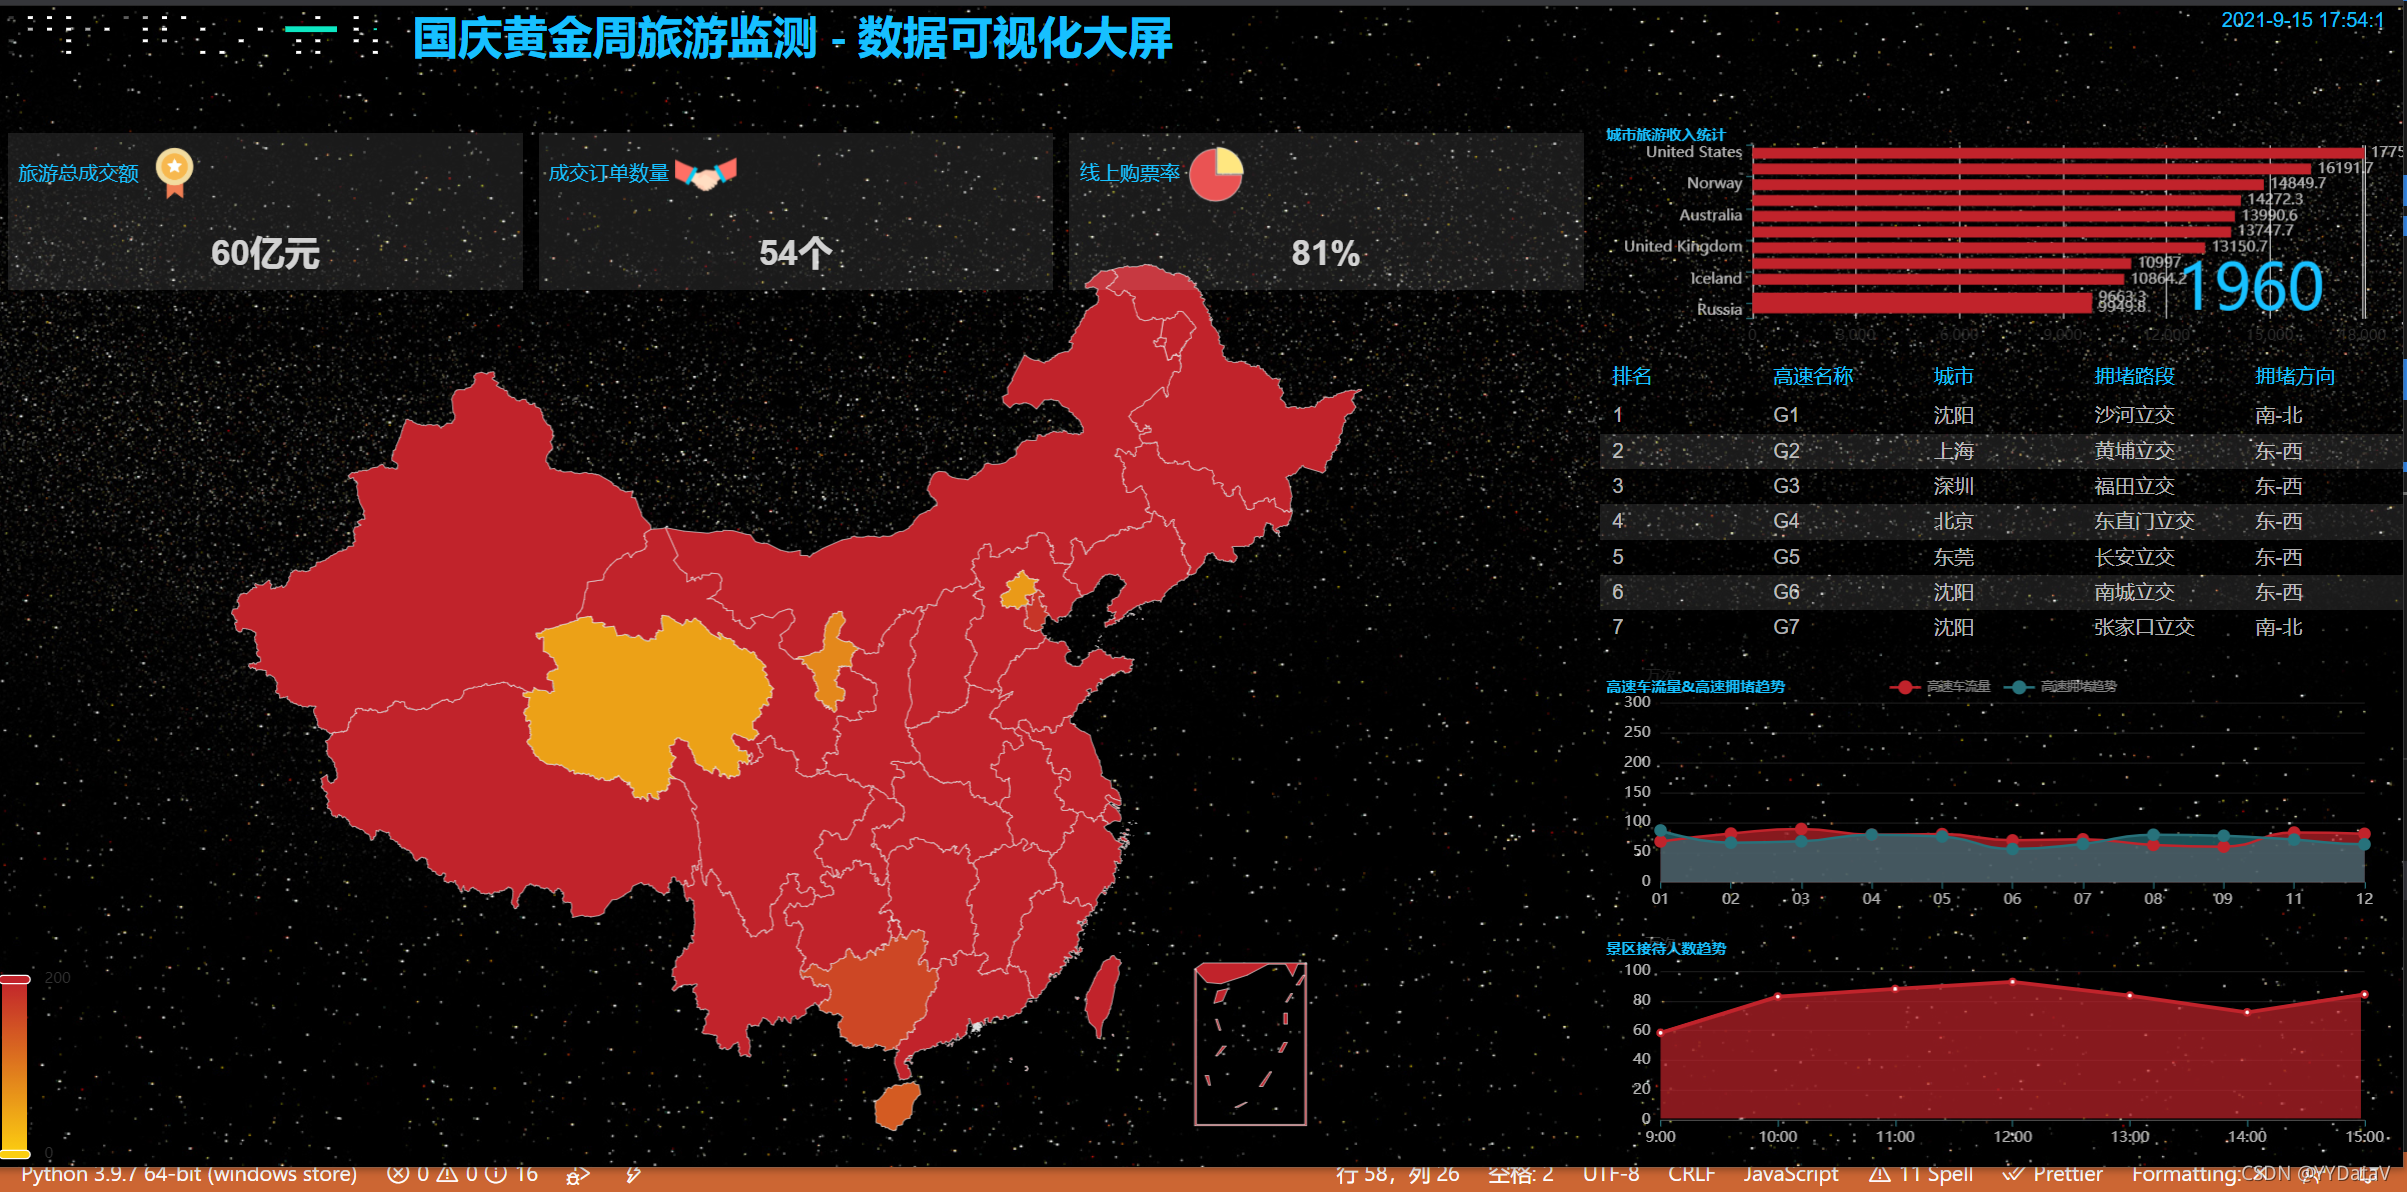
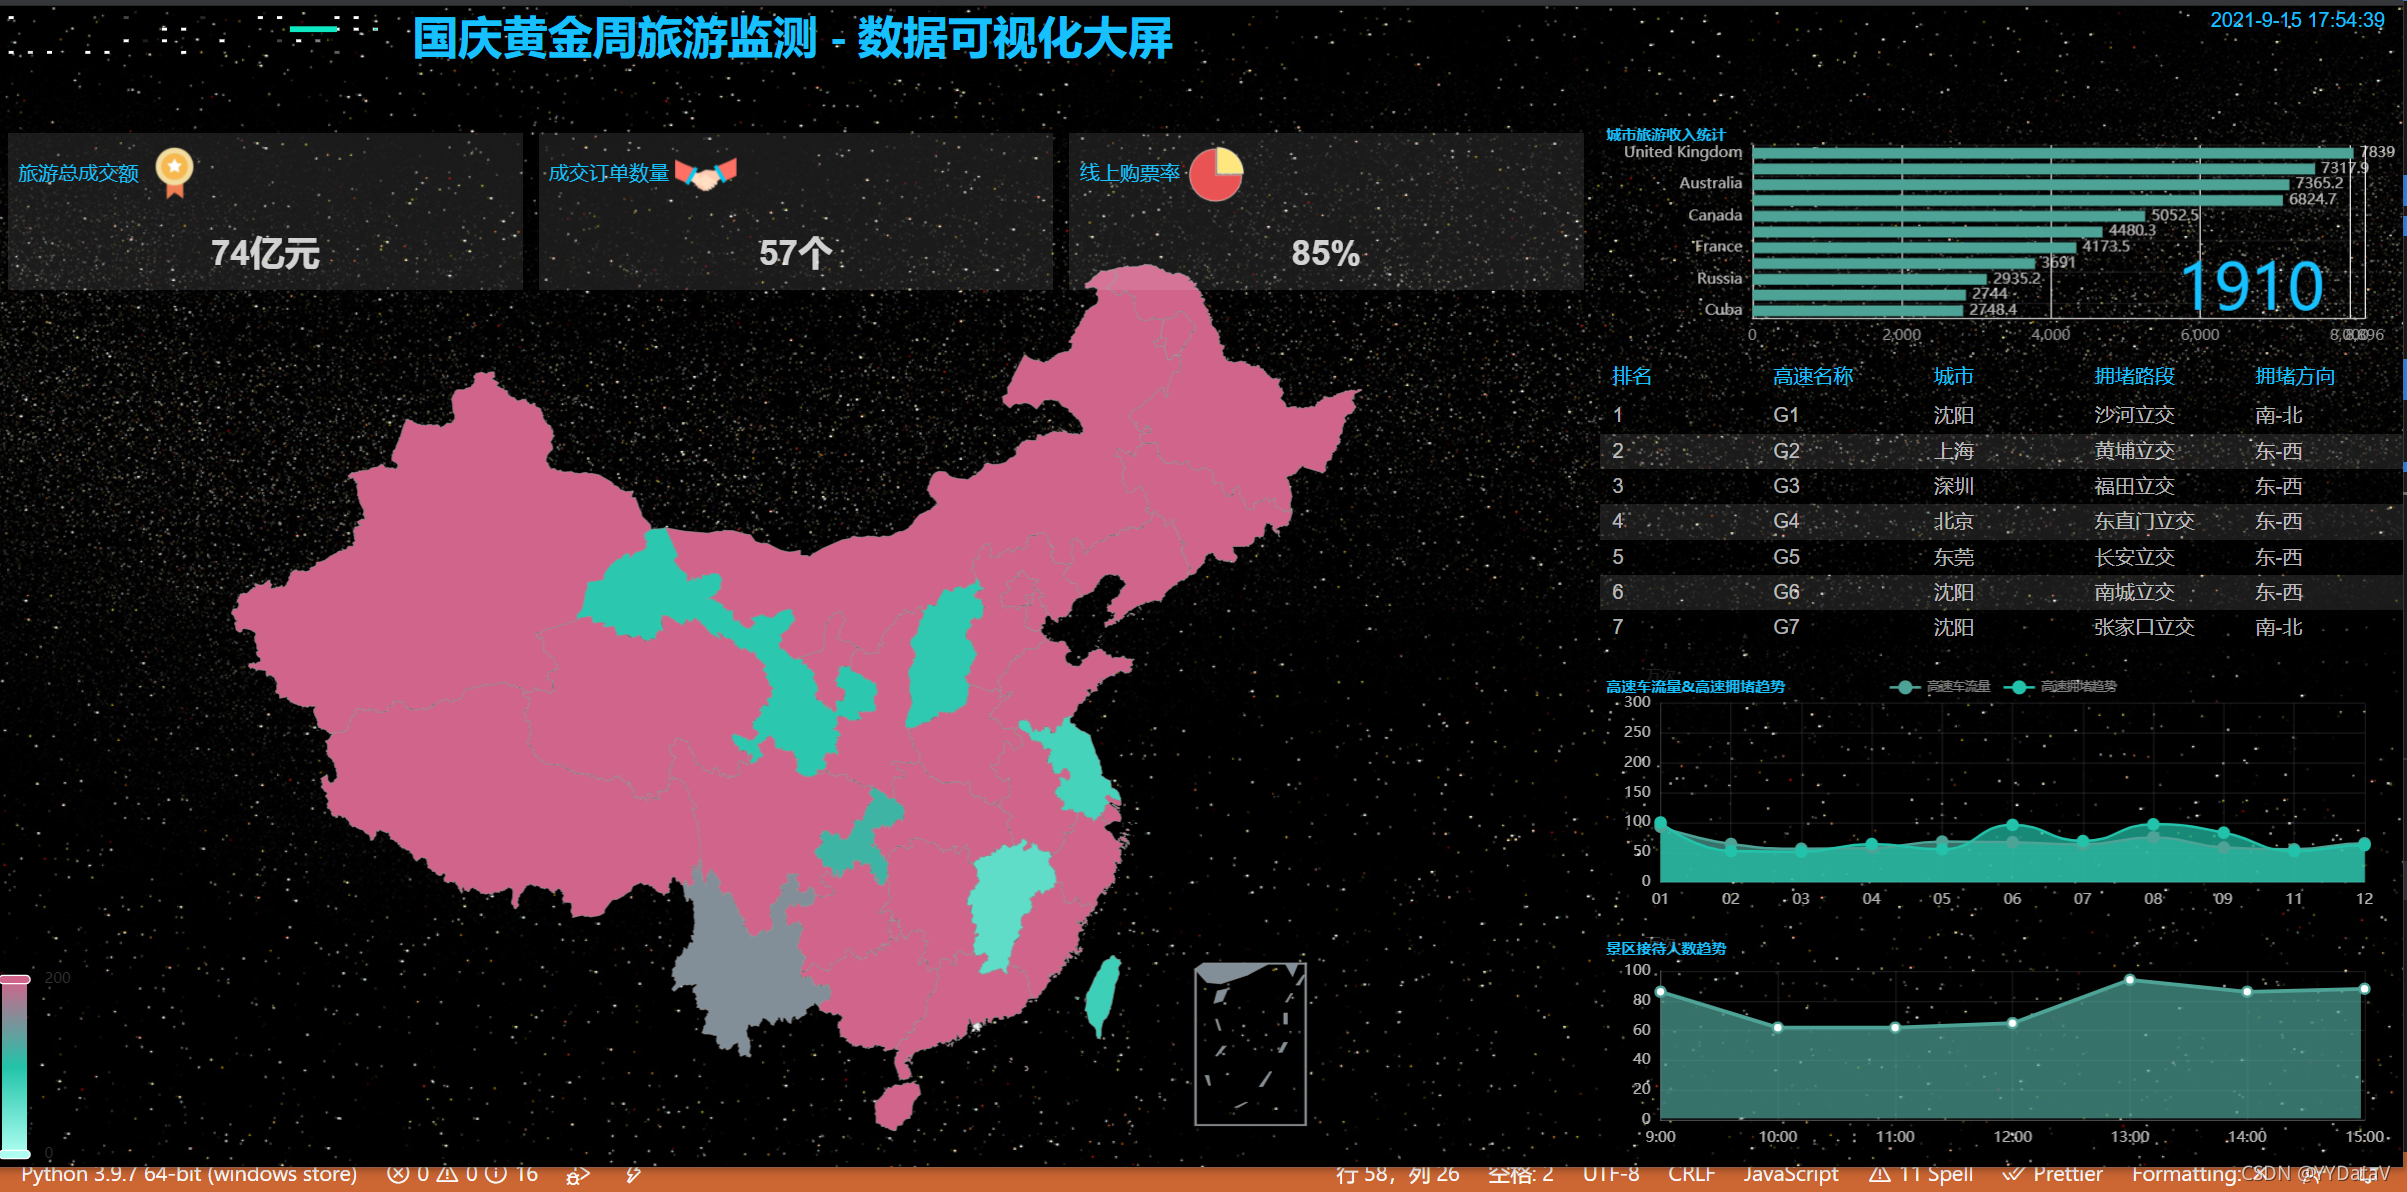
马上就要国庆黄金周了,小伙伴们是不是已经热血沸腾筹谋着去哪里玩一玩嗨一嗨,作为程序猿的我,脚步虽然还没走出去,但是 “酷炫吊炸天” 的霸道总裁大屏驾驶舱必须双手奉上,供大家参考交流。今天为大家分享的是 【国庆黄金周旅游监测 - 数据可视化大屏解决方案】。
前几天echarts5.*发布新版,所以我们也一定跟上脚步,该文的地图和柱状图切换即为最新版的功能,抢鲜体验了下,效果还是很炫滴!
话不多说,开始分享干货,欢迎讨论!QQ微信同号: 6550523
❤️效果展示❤️
1、首先看动态效果图
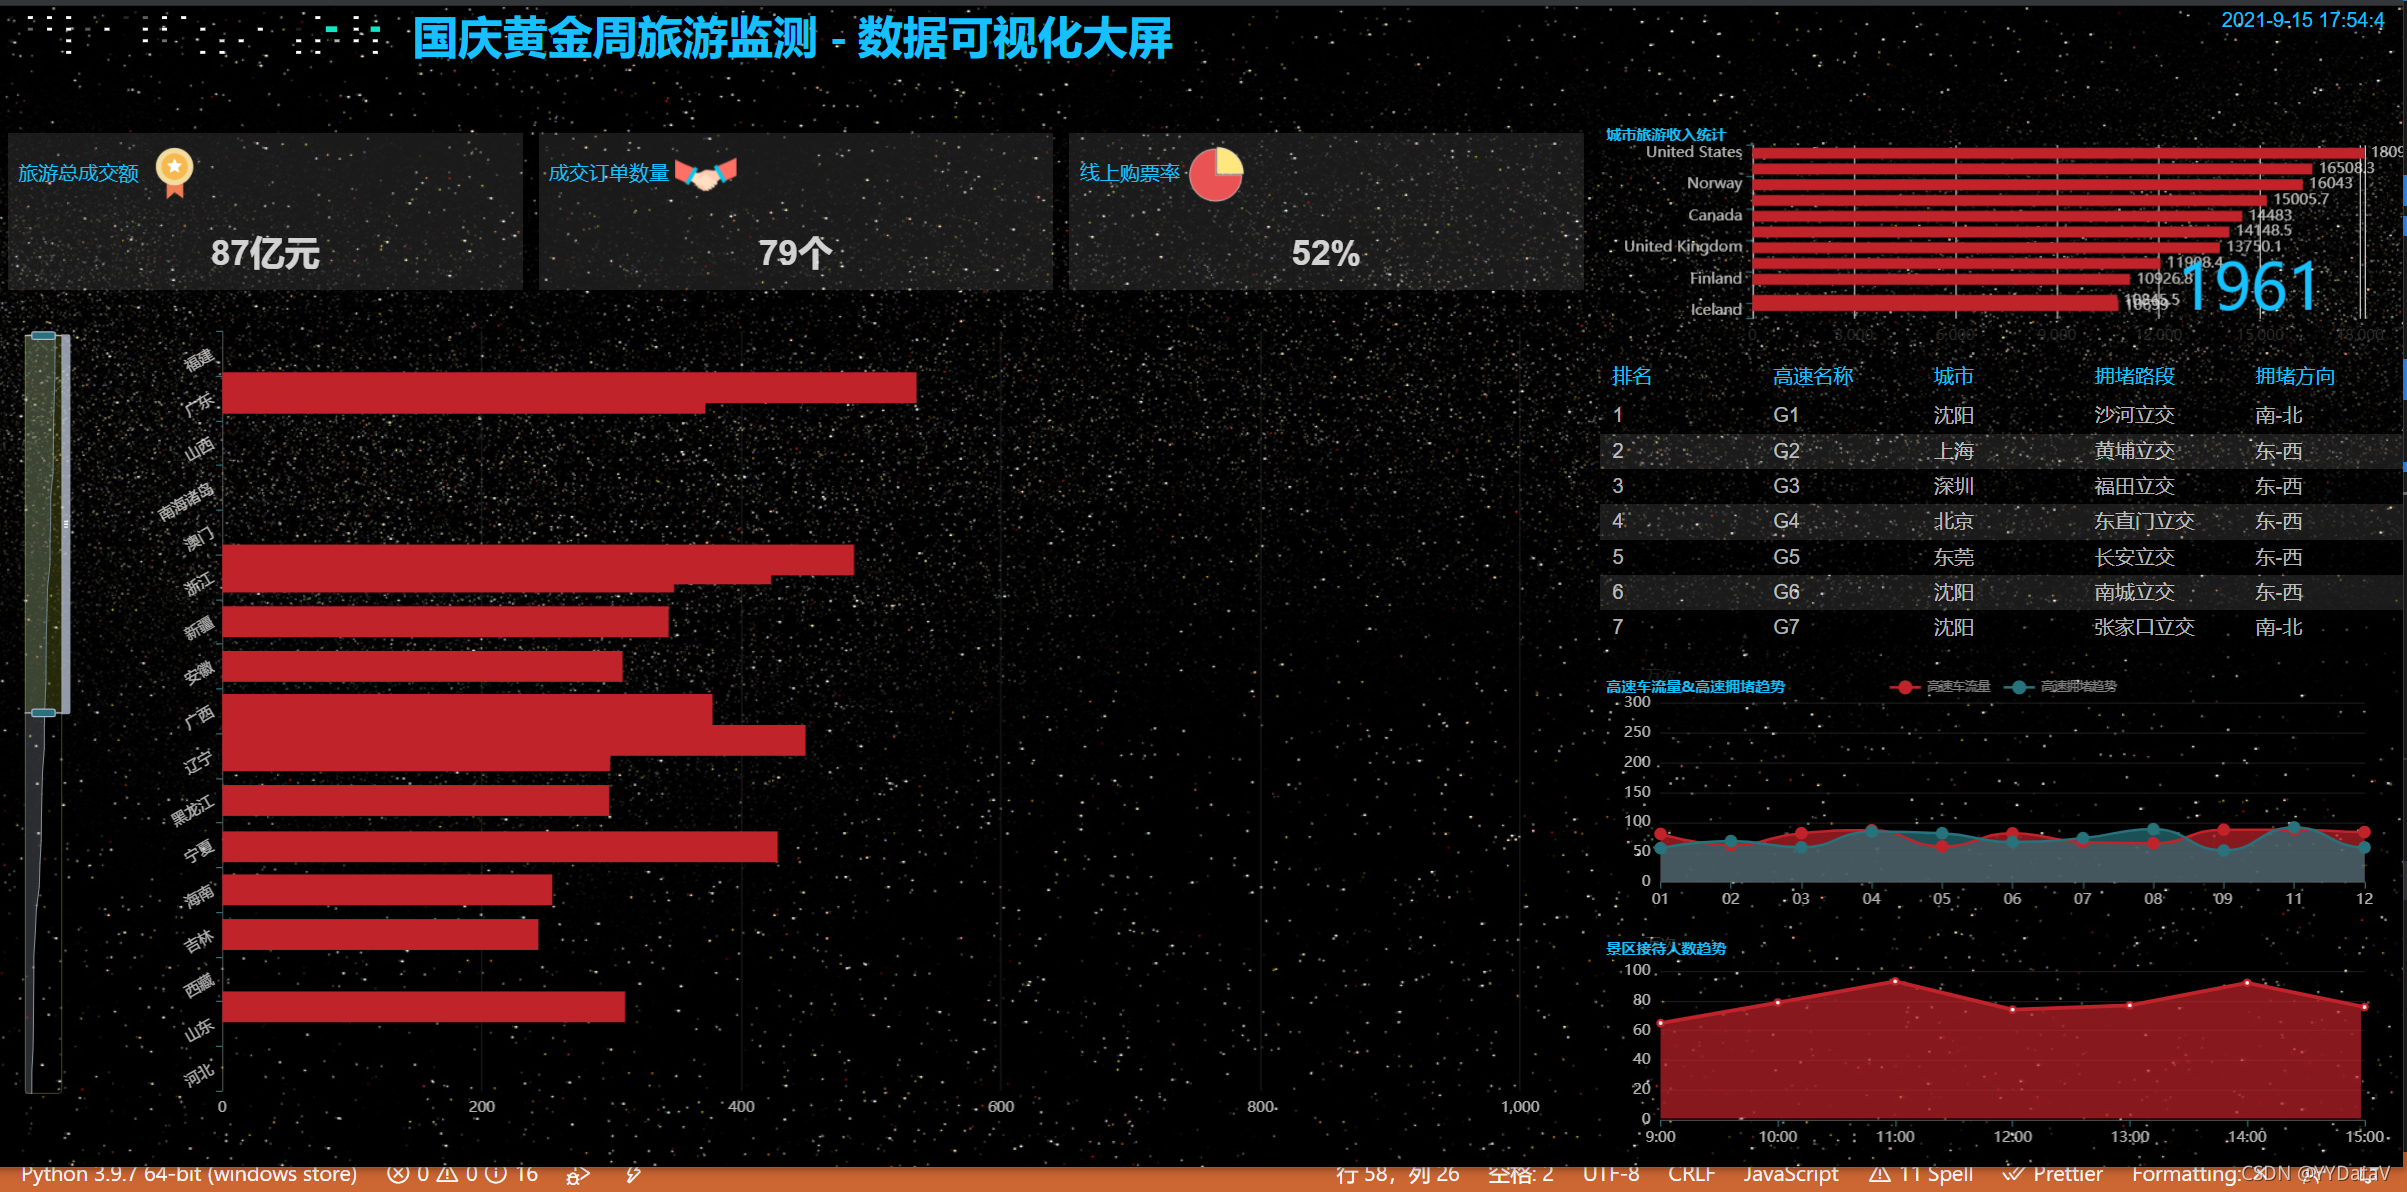
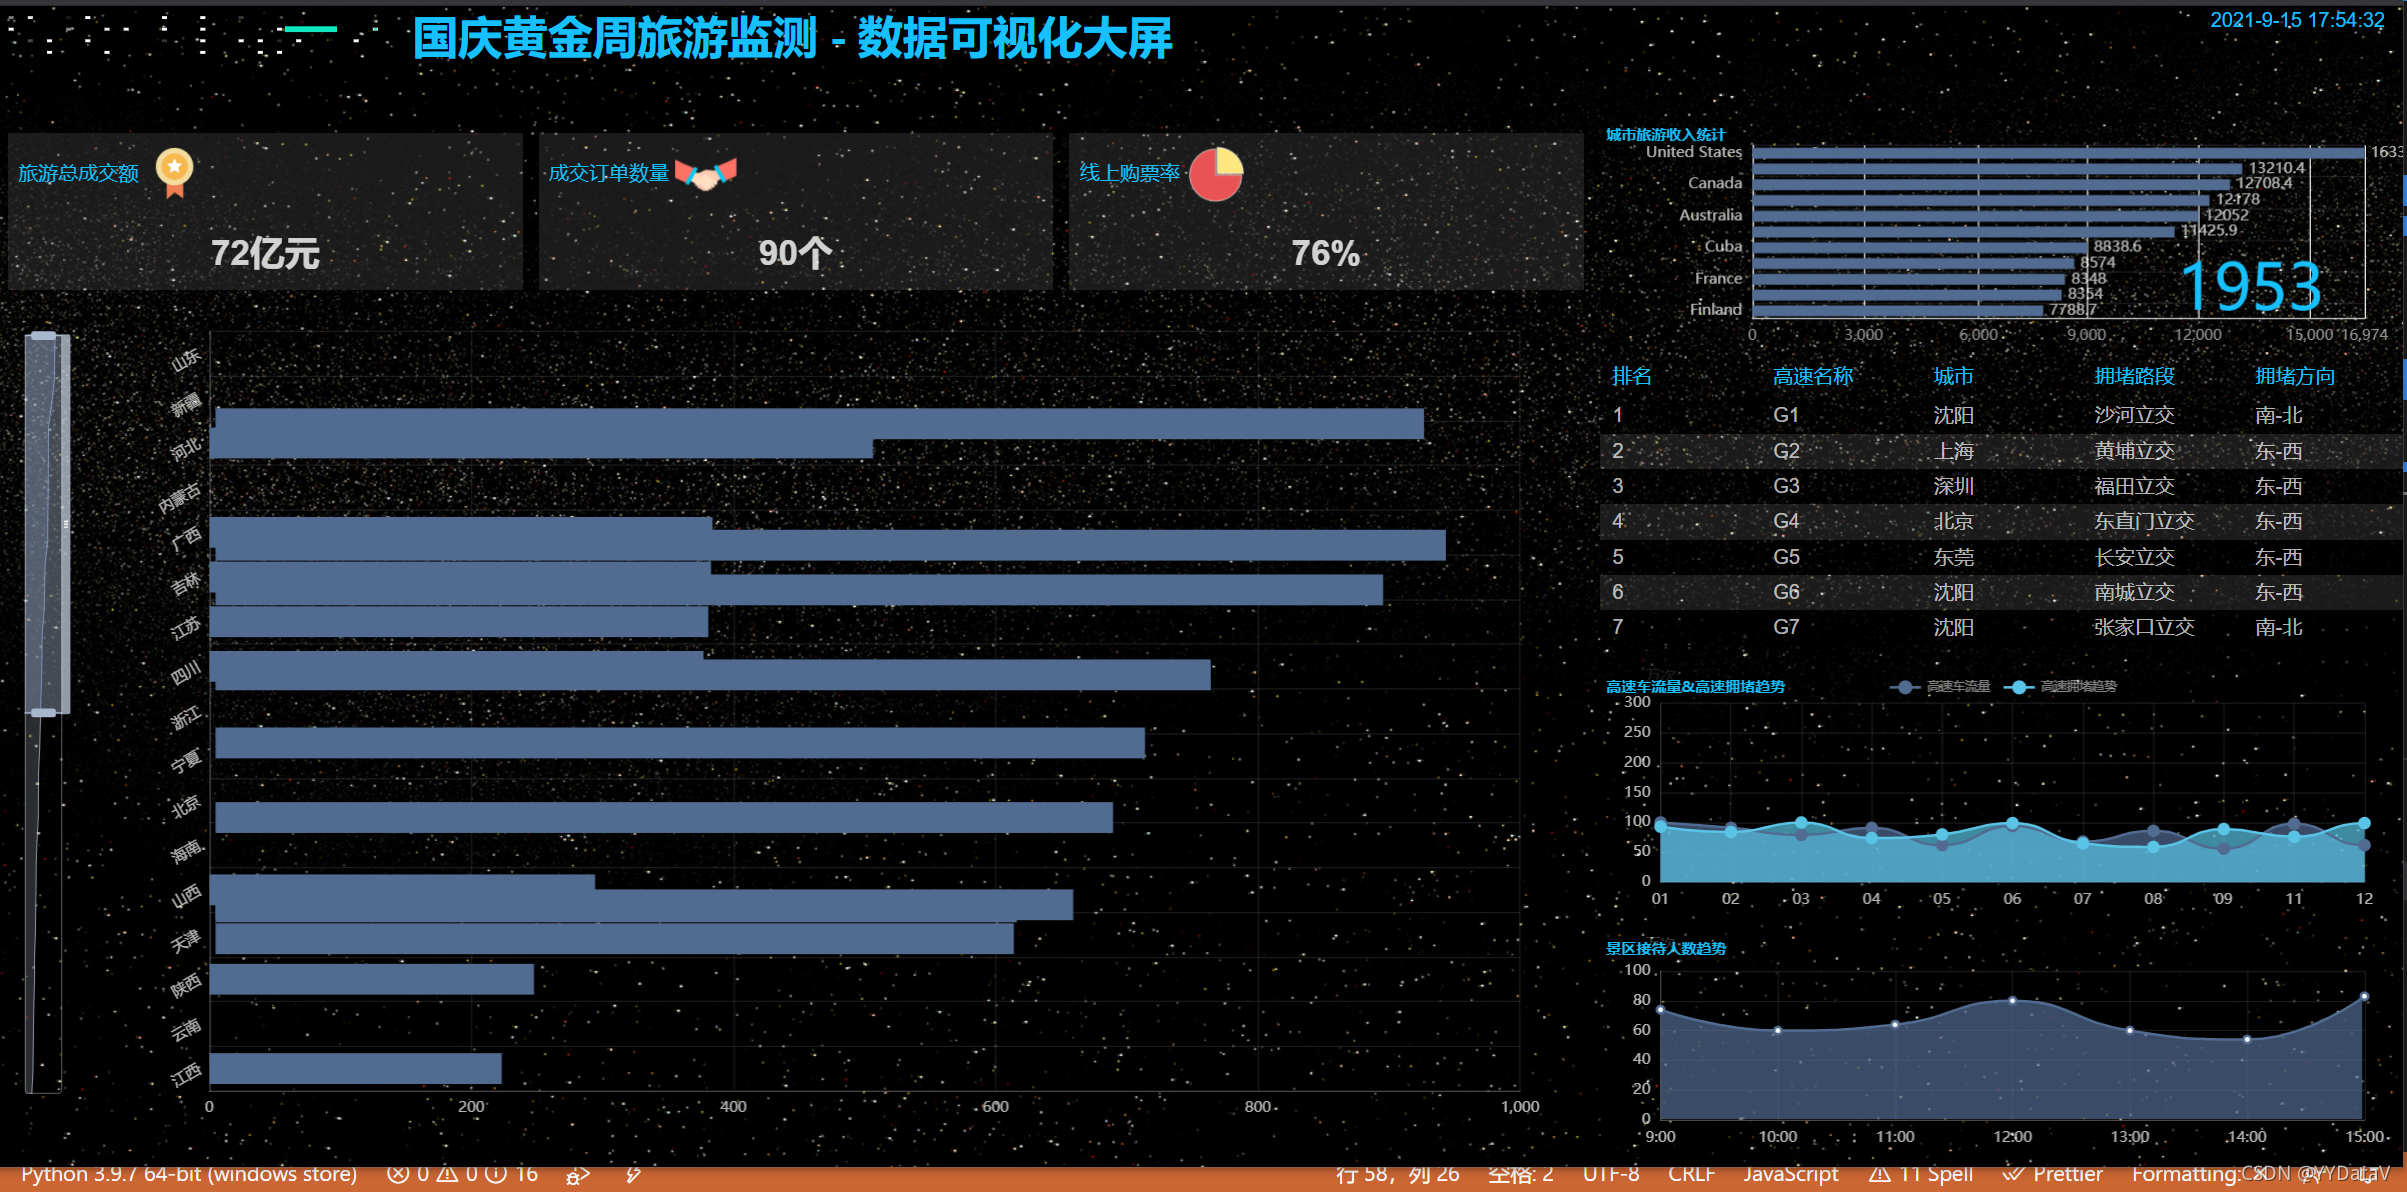
2、丰富的主题样式


一、 确定需求方案
1、确定产品上线部署的屏幕LED分辨率
1280px*768px,F11全屏后占满整屏无滚动条;其它分辨率屏幕可自适应显示。
2、功能模块
-
城市旅游收入统计
-
景区接待人数趋势
-
高速车流量&高速拥堵趋势
-
旅游总成交额
-
成交订单数量
-
线上购票率
3、部署方式
- 基于免安装可执行程序:支持Windows、Linux、Mac等各种主流操作系统;将可执行程序exe复制到服务器上即可,无需其它环境依赖;
- 观看方式:既可在服务器上直接观看程序界面,也可远程使用浏览器打开播放,支持Chrome浏览器、360浏览器等主流浏览器。
二、整体架构设计
- 前端基于Echarts开源库设计,使用WebStorm编辑器;
- 后端基于Python Web实现,使用Pycharm编辑器;
- 数据传输格式:JSON;
- 数据源类型:目前已支持PostgreSQL、MySQL、Oracle、Microsoft SQL Server、SQLite、Excel表格等,还可以定制HTTP API接口方式或其它类型数据库。
- 数据更新方式:摒弃了前端页面定时拉取的方式(这种方式带来严重的资源浪费),采用后端数据实时更新,实时推送到前端展示;
三、编码实现 (基于篇幅及可读性考虑,此处展示部分关键代码)
1、前端html代码
<body background="myimg/starfield.jpg">
      <div class="container_fluid">
            <div class="row_fluid" id="vue_app">
                  <div style="padding:0 0" class="col-xs-12 col-md-12">
                        <div style="padding: 0 0" class="col-xs-12 col-md-2">
                              <dv-decoration-1 style="width:100%;height:5%;" />
                          </div>
                        <div style="height:10%;" class="col-xs-12 col-md-6" id="container_0">  </div>
                        <div style="height:10%; color:#17c0ff; text-align: right;" class="col-xs-12 col-md-4" id="showTime"></div>
                  </div>

                  <div style="padding:0 0" class="col-xs-12 col-md-8">
                        <div style="height:90%;" id="container_1"></div>
                        <div class="div-title-1">
                              <p class="p-titile">旅游总成交额
                                    <img src="myimg/1.png" style="height: 40%; ">
                              </p>
                              <p id="container_2_1" class="p-value">
                                    12
                              </p>
                        </div>
                        <div class="div-title-2">
                              <p class="p-titile">成交订单数量
                                    <img src="myimg/2.png" style="height: 40%; ">
                              </p>
                              <p id="container_2_2" class="p-value">
                                    23
                              </p>
                        </div>
                        <div class="div-title-3">
                              <p class="p-titile">线上购票率
                                    <img src="myimg/3.png" style="height: 40%; ">
                              </p>
                              <p id="container_2_3" class="p-value">
                                    55
                              </p>
                        </div>
                  </div>

                  <div style="padding:0 0" class="col-xs-12 col-md-4">
                        <div style="height:20%;" id="container_2"></div>
                  </div>

                  <div style="padding:0 0" class="col-xs-12 col-md-4">
                        <div style="height:25%;" id="container_3">
                              <dv-scroll-board :config="config" />
                        </div>
                  </div>

                  <div style="padding:0 0" class="col-xs-12 col-md-4">
                        <div style="height:25%;" id="container_4"></div>
                  </div>

                  <div style="padding:0 0" class="col-xs-12 col-md-4">
                        <div style="height:20%;" id="container_5">
                        </div>
                  </div>
            </div>
      </div>

      <!-- theme -->
      <ul id="rightMenu" style="width: 200px;">
            <li><img src="myimg/drop-down.png"> 主题列表</li>
            <li>infographic</li>
            <li>macarons</li>
            <li>roma</li>
            <li>shine</li>
            <li>walden</li>
            <li>westeros</li>
            <li>wonderland</li>
            <li>vintage</li>
            <li>purple-passion</li>
            <li>chalk</li>
            <li>dark</li>
            <li>essos</li>
      </ul>
</body>
2、前端JS代码
    function initEchartLineArea(idContainer)
{
  var chartDom = document.getElementById(idContainer);
  var myChart = echarts.init(chartDom, window.gTheme);
  var option;

  option = {
    title: {
      text: "景区接待人数趋势",
      left: "left",
      textStyle: {
        color: "#17c0ff",
        fontSize: "12",
      },
    },
    grid: {
      left: "3%",
      top: "15%",
      right: "5%",
      bottom: "10%",
      containLabel: true,
    },
    tooltip: {
      trigger: "axis",
      axisPointer: {
        // Use axis to trigger tooltip
        type: "shadow", // 'shadow' as default; can also be 'line' or 'shadow'
      },
    },
    xAxis: {
      type: "category",
      boundaryGap: false,
      axisLabel: {
        textStyle: {
          color: "rgba(255,255,255,.7)",
          fontSize: 12,
        },
      },
      axisLine: {
        lineStyle: {
          color: "rgba(255,255,255,.2)",
        },
      },
      splitLine: {
        lineStyle: {
          color: "rgba(255,255,255,.1)",
        },
      },
      data: [],
    },
    yAxis: {
      name: "万次",
      type: "value",
      axisLabel: {
        textStyle: {
          color: "rgba(255,255,255,.7)",
          fontSize: 12,
        },
      },
      axisLine: {
        lineStyle: {
          color: "rgba(255,255,255,.2)",
        },
      },
      splitLine: {
        lineStyle: {
          color: "rgba(255,255,255,.1)",
        },
      },
    },
    series: [
      {
        data: [],
        type: "line",
        areaStyle: {},
      },
    ],
  };

  option && myChart.setOption(option);
  window.addEventListener("resize", function () {
    myChart.resize();
  });
}
function asyncDataLineArea(filename,idContainer) {
  $.getJSON(filename).done(function (data) {
    var myChart = echarts.init(document.getElementById(idContainer));
    myChart.setOption({
      xAxis: data["xAxis"],
      series: data["series"],
    });
  }); //end $.getJSON
}
function initEchartLineMulti(idContainer) {
  var myChart = echarts.init(
    document.getElementById(idContainer),
    window.gTheme
  );

  option = {
    title: {
      top: "10%",
      text: "高速车流量&高速拥堵趋势",
      left: "left",
      textStyle: {
        color: "#17c0ff",
        fontSize: "12",
      },
    },
    tooltip: {
      trigger: "axis",
      axisPointer: {
        lineStyle: {
          color: "#dddc6b",
        },
      },
    },
    legend: {
      top: "10%",
      data: ["高速车流量", "高速拥堵趋势"],
      textStyle: {
        color: "rgba(255,255,255,.5)",
        fontSize: 10,
      },
    },
    grid: {
      left: "3%",
      top: "20%",
      right: "5%",
      bottom: "10%",
      containLabel: true,
    },

    xAxis: [
      {
        type: "category",
        boundaryGap: false,
        axisLabel: {
          textStyle: {
            color: "rgba(255,255,255,.7)",
            fontSize: 12,
          },
        },
        axisLine: {
          lineStyle: {
            color: "rgba(255,255,255,.2)",
          },
        },
        splitLine: {
          lineStyle: {
            color: "rgba(255,255,255,.1)",
          },
        },
      },
    ],

    yAxis: [
      {
        type: "value",
        name: "万次",
        min: 0,
        max: 300,
        axisTick: { show: false },
        axisLabel: {
          textStyle: {
            color: "rgba(255,255,255,.7)",
            fontSize: 12,
          },
          // formatter: '{value} KM',
        },

        axisLine: {
          lineStyle: {
            color: "rgba(255,255,255,.1)",
          },
        },

        splitLine: {
          lineStyle: {
            color: "rgba(255,255,255,.1)",
          },
        },
      },
    ],
    series: [
      {
        name: "高速车流量",
        type: "line",
        // 平滑曲线 或 折线
        smooth: true,
        // 面接图
        areaStyle: {},
        symbol: "circle",
        symbolSize: 10,
        lineStyle: {
          normal: {
            // color: '#0184d5',
            width: 2,
          },
        },
        data: [],
      },
      {
        name: "高速拥堵趋势",
        type: "line",
        smooth: true,
        // 面接图
        areaStyle: {},
        symbol: "circle",
        symbolSize: 10,
        lineStyle: {
          normal: {
            // color: '#0184d5',
            width: 2,
          },
        },
        data: [],
      },
    ],
  };

  // 使用刚指定的配置项和数据显示图表。
  myChart.setOption(option);
  window.addEventListener("resize", function () {
    myChart.resize();
  });
}

function asyncDataLineMulti(filename, idContainer) {
  $.getJSON(filename).done(function (data) {
    var myChart = echarts.init(document.getElementById(idContainer));

    myChart.setOption({
      xAxis: data["xAxis"],
      series: data["series"],
    });
  }); //end $.getJSON
}
3、后端python代码
     # -*- coding:utf-8 -*-

import io
import os
import sys
import urllib
import json
from http.server import HTTPServer, SimpleHTTPRequestHandler, ThreadingHTTPServer

ip = "localhost"   # 监听IP,配置项
port = 8813       # 监听端口,配置项
index_url = "http://%s:%d/index.html" %(ip, port)  # 监听主页url,配置项

class MyRequestHandler(SimpleHTTPRequestHandler):
    protocol_version = "HTTP/1.0"
    server_version = "PSHS/0.1"
    sys_version = "Python/3.7.x"
    target = "./"  # 监听目录,配置项

    def do_GET(self):
        if self.path.find("/json/") > 0:
            print(self.path)
            req = {"success": "true"}
            self.send_response(200)
            self.send_header("Content-type", "json")
            self.end_headers()
            with open(self.path, 'r', encoding="utf-8") as f:
                data = json.load(f)
                rspstr = json.dumps(data)
                self.wfile.write(rspstr.encode("utf-8"))

        else:
            SimpleHTTPRequestHandler.do_GET(self);

    def do_POST(self):
        if self.path == "/signin":
            print("postmsg recv, path right")
        else:
            print("postmsg recv, path error")
            data = self.rfile.read(int(self.headers["content-length"]))
            data = json.loads(data)
            self.send_response(200)
            self.send_header("Content-type", "text/html")
            self.end_headers()
            rspstr = "recv ok, data = "
            rspstr += json.dumps(data, ensure_ascii=False)
            self.wfile.write(rspstr.encode("utf-8"))


def HttpServer():
    try:
        server = HTTPServer((ip, port), MyRequestHandler)
        listen = "http://%s:%d" %(ip, port)
        print("服务器监听地址: ", listen)
        server.serve_forever()
    except ValueError as e:
        print("Exception", e)
        server.socket.close()

if __name__ == "__main__":
    HttpServer()
四、上线运行

五、源码下载
本次分享结束,欢迎讨论!QQ微信同号: 6550523
❤️系列文章❤️
❤️数据可视化❤️:基于 Echarts + Python 实现的大屏范例【12】(你想要的酷炫世界地图在这里了!)_小魔怪的博客-CSDN博客
数据可视化:基于 Echarts + Python 实现的动态实时大屏范例【11】
数据可视化:基于 Echarts + Python 实现的动态实时大屏范例【十】
数据可视化:基于 Echarts + Python 实现的动态实时大屏范例【九】
数据可视化:基于 Echarts + Python 实现的动态实时大屏范例【八】
数据可视化:基于 Echarts + Python 实现的动态实时大屏范例【七】
数据可视化:基于 Echarts + Python 实现的动态实时大屏范例【六】
数据可视化:基于 Echarts + Python 实现的动态实时大屏范例【五】
数据可视化:基于 Echarts + Python 实现的动态实时大屏范例【四】
数据可视化:基于 Echarts + Python 实现的动态实时大屏范例【三】
数据可视化:基于 Echarts + Python 实现的动态实时大屏范例【二】
数据可视化:基于 Echarts + Python 实现的动态实时大屏范例【一】
数据可视化:基于 Pyecharts + PyQT 实现的动态实时拖拉拽大屏范例【一】