Python访问街区所有节点最短路径问题,并结合matplotlib可视化
- 1. 效果图
- 2. 源码
- 2.1 5个点全排列(递归+非递归算法)
- 2.2 python遍历全路径计算距离+matplot可视化
- 2.3 pyecharts可视化源码
- 参考
写这篇博客 基于博友的提问,这篇博客将介绍如何全排列街区的点,即规定起点不重复的走完所有街区,并找出最短路径。
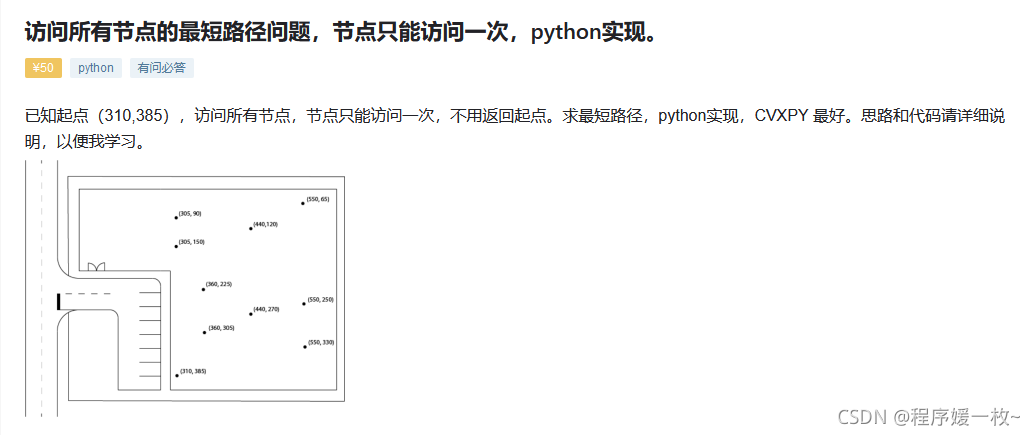
 这个问题分拆分为三部分:
1. N个点除去起点,即N-1个点全排列;
2. 计算每一条路径,相邻节点的距离,并求和。
3. 为了更加直观,便于可视化,可以matplotlib、pyecharts绘制路线出来~
1. 效果图
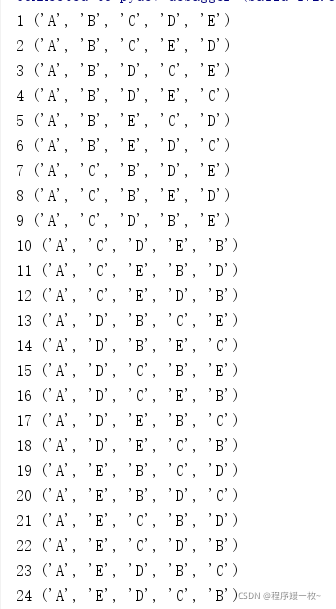
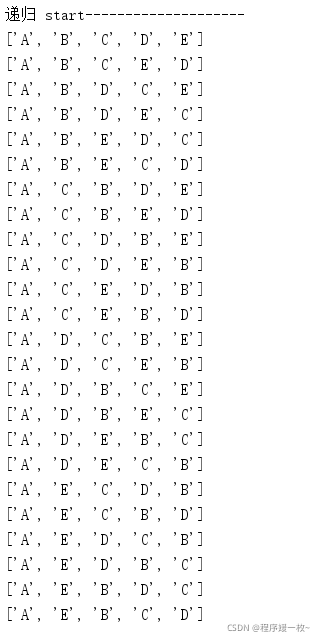
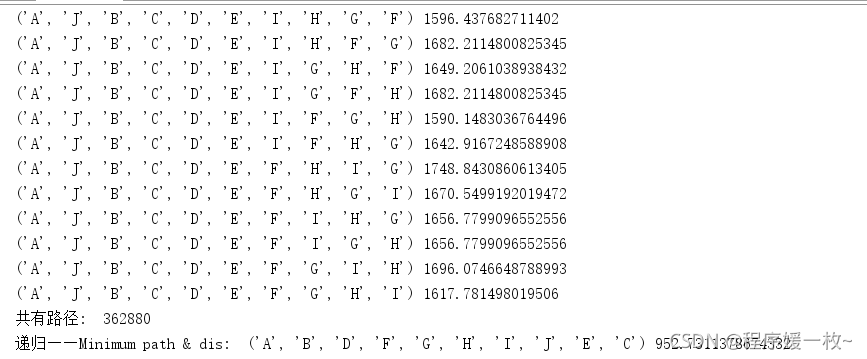
规定起点A,所有路径 递归 & 非递归效果图:
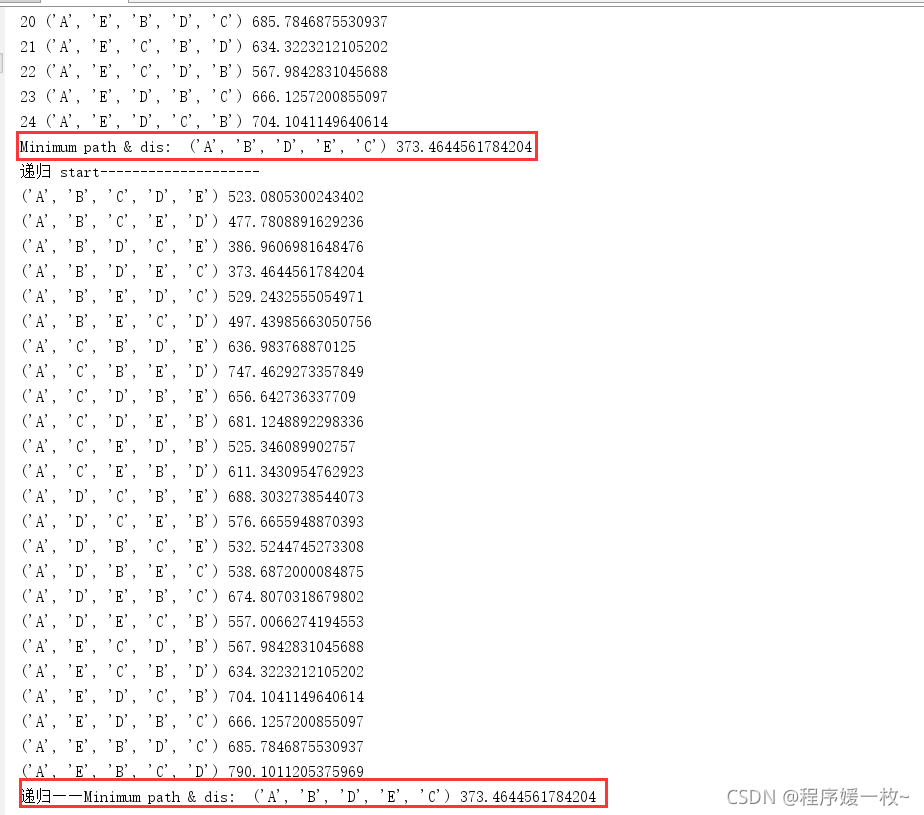
最短路径,及其距离效果图:
图中10个点的最短路径结果:
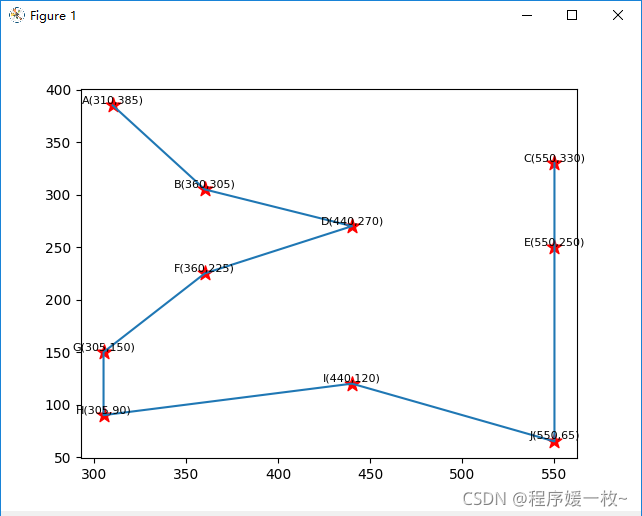
使用matplotlib 可视化街区点及最短路径如下图:
如上最短路径 A B D F G H I J E C 如下图,
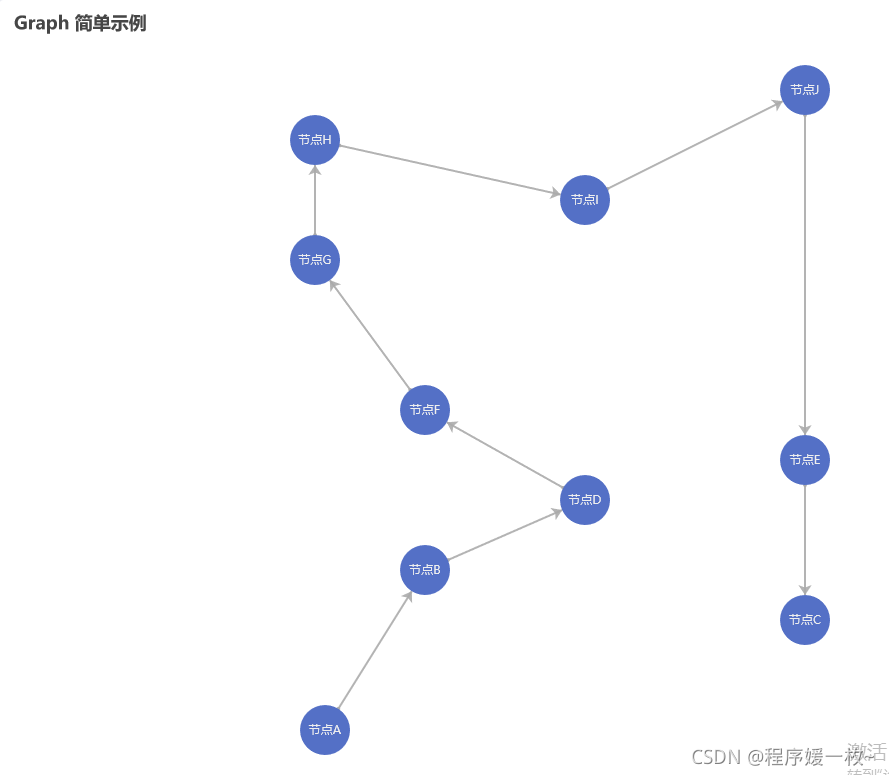
使用pyecharts绘制街区点及最短路径如下图:
2. 源码
2.1 5个点全排列(递归+非递归算法)
非递归的方法并不好,当点数有变化的时候需要对应修改代码
# 求最短路径问题(N个点全排列)

# 街区点
node = ['A', 'B', 'C', 'D', 'E']

# 路径全排列走法
count = 0
# 非递归算法
# 非递归算法找到所有可能的路径,并计算总距离
for i in node:
    for j in node:
        for k in node:
            for m in node:
                for n in node:
                    if i != 'A':  # 起点只能是A点
                        continue
                    # 同一个点不走第二次
                    if (i == j or i == k or i == m or i == n
                        or j == k or j == m or j == n
                        or k == m or k == n
                        or m == n):
                        continue
                    count = count + 1
                    print((count), (i, j, k, m, n))

print('递归 start--------------------')
# 递归方法解决
nodes = node.copy()


# 递归算法:
# 不重复的对n个点进行全排列
# positon,从数组下标哪个点开始全排列
def permutations(position):
    if position == len(nodes) - 1:
        print(nodes)
    else:
        for index in range(position, len(nodes)):
            nodes[index], nodes[position] = nodes[position], nodes[index]
            permutations(position + 1)
            nodes[index], nodes[position] = nodes[position], nodes[index]


# permutations(0) # 全排列
permutations(1)  # 从第2个点开始全排列
2.2 python遍历全路径计算距离+matplot可视化
# 求最短路径问题(python遍历全路径计算距离+matplot可视化)
import math
import numpy as np

# 街区点
node = ['A', 'B', 'C', 'D', 'E', 'F', 'G', 'H', 'I', "J"]
# 街区点对应坐标
node_coor = [(310, 385), (360, 305), (550, 330), (440, 270), (550, 250),
             (360, 225), (305, 150), (305, 90), (440, 120), (550, 65)]

# 计算俩个坐标点的距离
def cal_dis(pt1, pt2):
    x0, y0 = pt1
    x1, y1 = pt2
    # print('\t\tdis: ', pt1, pt2, math.sqrt((math.pow((x0 - x1), 2) + math.pow((y0 - y1), 2))))
    return math.sqrt((math.pow((x0 - x1), 2) + math.pow((y0 - y1), 2)))


# 计算一条路径的总距离
def get_dis(nodes):
    # 初始化总距离
    total_dis = 0

    # 遍历路径
    for i in range(len(nodes) - 1):
        # 根据相邻的俩个点计算距离
        dis = cal_dis(node_coor[node.index(nodes[i])], node_coor[node.index(nodes[i + 1])])
        total_dis = total_dis + dis
    return total_dis


print('递归 start--------------------')
# 递归方法解决
dict_path_dis = {}
nodes = node.copy()


# 递归算法:
# 不重复的对n个点进行全排列
# positon,从数组下标哪个点开始全排列
def permutations(position):
    if position == len(nodes) - 1:
        dis = get_dis(np.array(tuple(nodes)))
        dict_path_dis[tuple(nodes)] = dis
        print(tuple(nodes), dis)
    else:
        for index in range(position, len(nodes)):
            nodes[index], nodes[position] = nodes[position], nodes[index]
            permutations(position + 1)
            nodes[index], nodes[position] = nodes[position], nodes[index]


# 从下标1开始全排列,表示第一个值是固定的,此处是起点
permutations(1)

print('共有路径: ', len(dict_path_dis.keys()))
# 获取最小的value对应的key,即获取最短路径距离对应的路径
key_min = min(dict_path_dis.keys(), key=(lambda k: dict_path_dis[k]))
print('递归——Minimum path & dis: ', key_min, dict_path_dis[key_min])

print('绘图start——————————')
# 构建最短路径的街区点及坐标
min_node = np.array(key_min)
min_path_coor = []
for i in min_node:
    min_path_coor.append(node_coor[node.index(i)])

print('min_node: ', min_node)
print('min_path_coor: ', min_path_coor)

import matplotlib.pyplot as plt
import numpy as np

fig, ax = plt.subplots()  # 创建一个图表
x1 = [x for (x, y) in min_path_coor]
y1 = [y for (x, y) in min_path_coor]
# ax.scatter(x1, y1, marker='*', c='red') # 绘制街区点

for node_name, (x, y) in zip(min_node, min_path_coor):
    # 绘制坐标点及坐标点上方文字
    plt.scatter(x, y, s=120, c='red', marker='*')
    plt.text(x=x, y=y + 2, s=node_name + '(' + str(x) + ',' + str(y) + ')', ha='center', va='baseline',
             fontdict={'color': 'black',
                       'size': 8})  # 中心点上方文字
ax.plot(x1, y1)  # 绘制线

plt.show()
2.3 pyecharts可视化源码
可在该页面复制下方代码进行在线可视化:https://echarts.apache.org/examples/en/editor.html?c=graph-simple
option = {
    title: {
        text: 'Graph 简单示例'
    },
    tooltip: {},
    animationDurationUpdate: 1500,
    animationEasingUpdate: 'quinticInOut',
    series: [
        {
            type: 'graph',
            layout: 'none',
            symbolSize: 50,
            roam: true,
            label: {
                show: true
            },
            edgeSymbol: ['circle', 'arrow'],
            edgeSymbolSize: [4, 10],
            edgeLabel: {
                fontSize: 20
            },
            data: [{
                name: '节点A',
                x: 310,
                y: 385
            }, {
                name: '节点B',
                x: 360,
                y: 305
            }, {
                name: '节点C',
                x: 550,
                y: 330
            }, {
                name: '节点D',
                x: 440,
                y: 270
            }, {
                name: '节点E',
                x: 550,
                y: 250
            }, {
                name: '节点F',
                x: 360,
                y: 225
            }, {
                name: '节点G',
                x: 305,
                y: 150
            }, {
                name: '节点H',
                x: 305,
                y: 90
            }, {
                name: '节点I',
                x: 440,
                y: 120
            }, {
                name: '节点J',
                x: 550,
                y: 65
            }],
            links: [{
                source: '节点A',
                target: '节点B'
            }, {
                source: '节点B',
                target: '节点D'
            }, {
                source: '节点D',
                target: '节点F'
            }, {
                source: '节点F',
                target: '节点G'
            }, {
                source: '节点G',
                target: '节点H'
            }, {
                source: '节点H',
                target: '节点I'
            }, {
                source: '节点I',
                target: '节点J'
            }, {
                source: '节点J',
                target: '节点E'
            }, {
                source: '节点E',
                target: '节点C'
            }],
            lineStyle: {
                opacity: 0.9,
                width: 2,
                curveness: 0
            }
        }
    ]
};
参考
- python实现四个数字的全排列