目录
1 LSTM原理
2 LSTM与RNN的区别
3 LSTM的具体结构介绍
3.1 LSTM在时间上的整体构架
3.2 控制c和h的构架
3.2 遗忘门输出门输入门具体情况
4 LSTM实战
5 代码展示
5.1 数据预处理代码
5.2 LSTM 代码
1 LSTM原理
LSTM(Long Short-Term Memory),作为一种特殊的循环神经网络(RNN)结构,通过引入遗忘门、输入门和输出门这三种类型的门控机制来控制信息的流动,从而有效解决了传统RNN在处理长序列时容易出现的梯度消失和梯度爆炸问题。这些门结构使得LSTM能够记住长期依赖的信息,并在自然语言处理、语音识别、机器翻译等众多领域中展现出强大的序列处理能力。
2 LSTM与RNN的区别
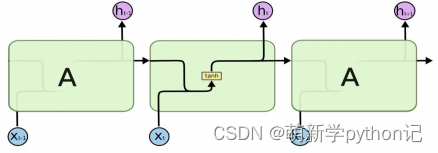
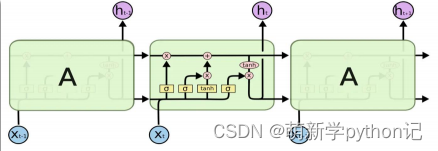
LSTM 是RNN一种,大体结构几乎一样。区别是:它的“记忆细胞”改造过、该记的信息会一直传递,不该记的会被“门”截断。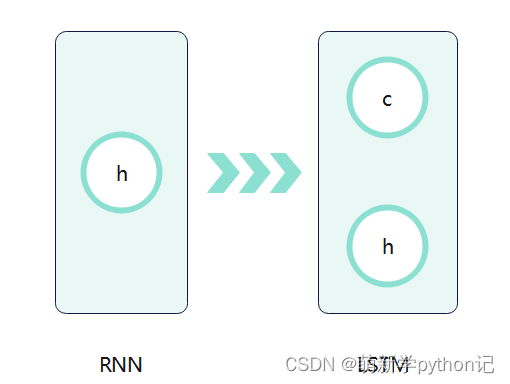
3 LSTM的具体结构介绍
3.1 LSTM在时间上的整体构架
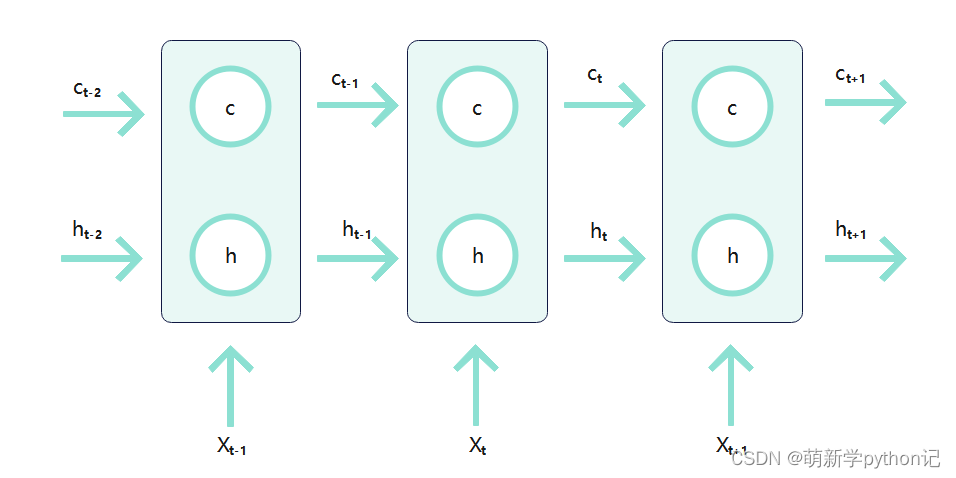
3.2 控制c和h的构架
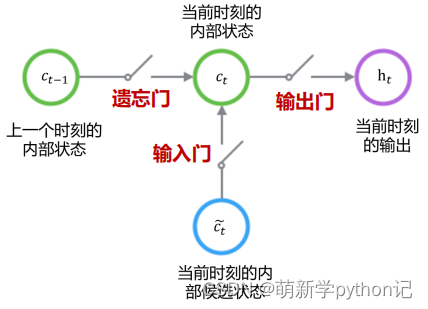
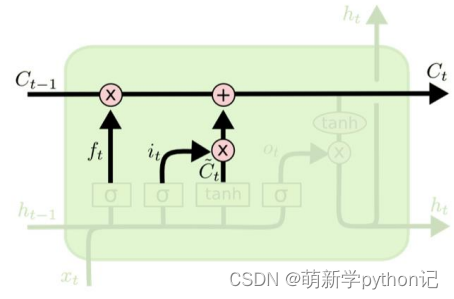
遗忘门(forget gate):① 遗忘门可以保存很久很久之前的信息。 ② 它决定了上一时刻的单元内部状态 ??−1,有多少保留到当前时刻内部状态 ??。
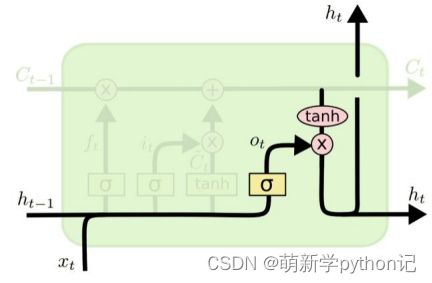
输入门(input gate):① 它决定了当前时刻网络的输入 xt有多少保存到当前单元内部状态 ct。 输出门(output gate):① 控制单元内部状态 ?? 有多少输出到 LSTM 的当前输出值 ℎ?。3.2 遗忘门输出门输入门具体情况
全部门的构造总图
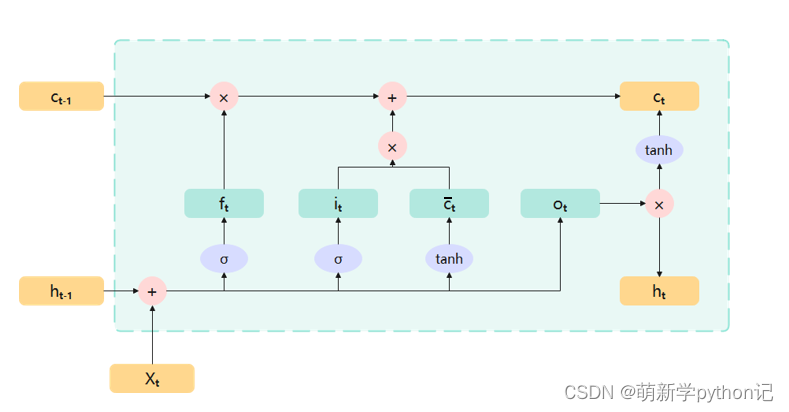
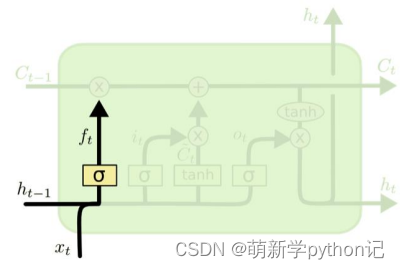
遗忘门: 
门的值在[0,1]之间:0代表“全部遗忘”(关闭),不允许任何信息通过; 1代表“全部保留”(开放),允许所有信息通过。
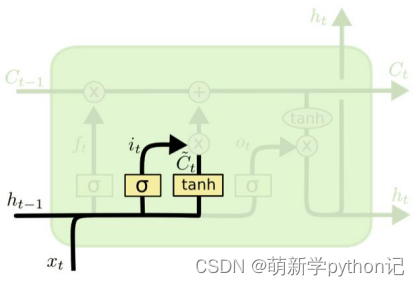
输入门:
 和
和 通过输入门的sigmoid层决定加入哪些新信息。
候选记忆单元:
 和
和 通过tanh层,生成一个候选记忆向量
 。
。
内部记忆单元:
更新旧的细胞信息 ,变为新的细胞信息
 。
。
输出门:
隐层输出:
控制每个内存单元的输出信息。通过tanh函数,将输出值控制在-1到1之间。
4 LSTM实战
数据来源:澳大利亚的雨 (kaggle.com)
数据展示:
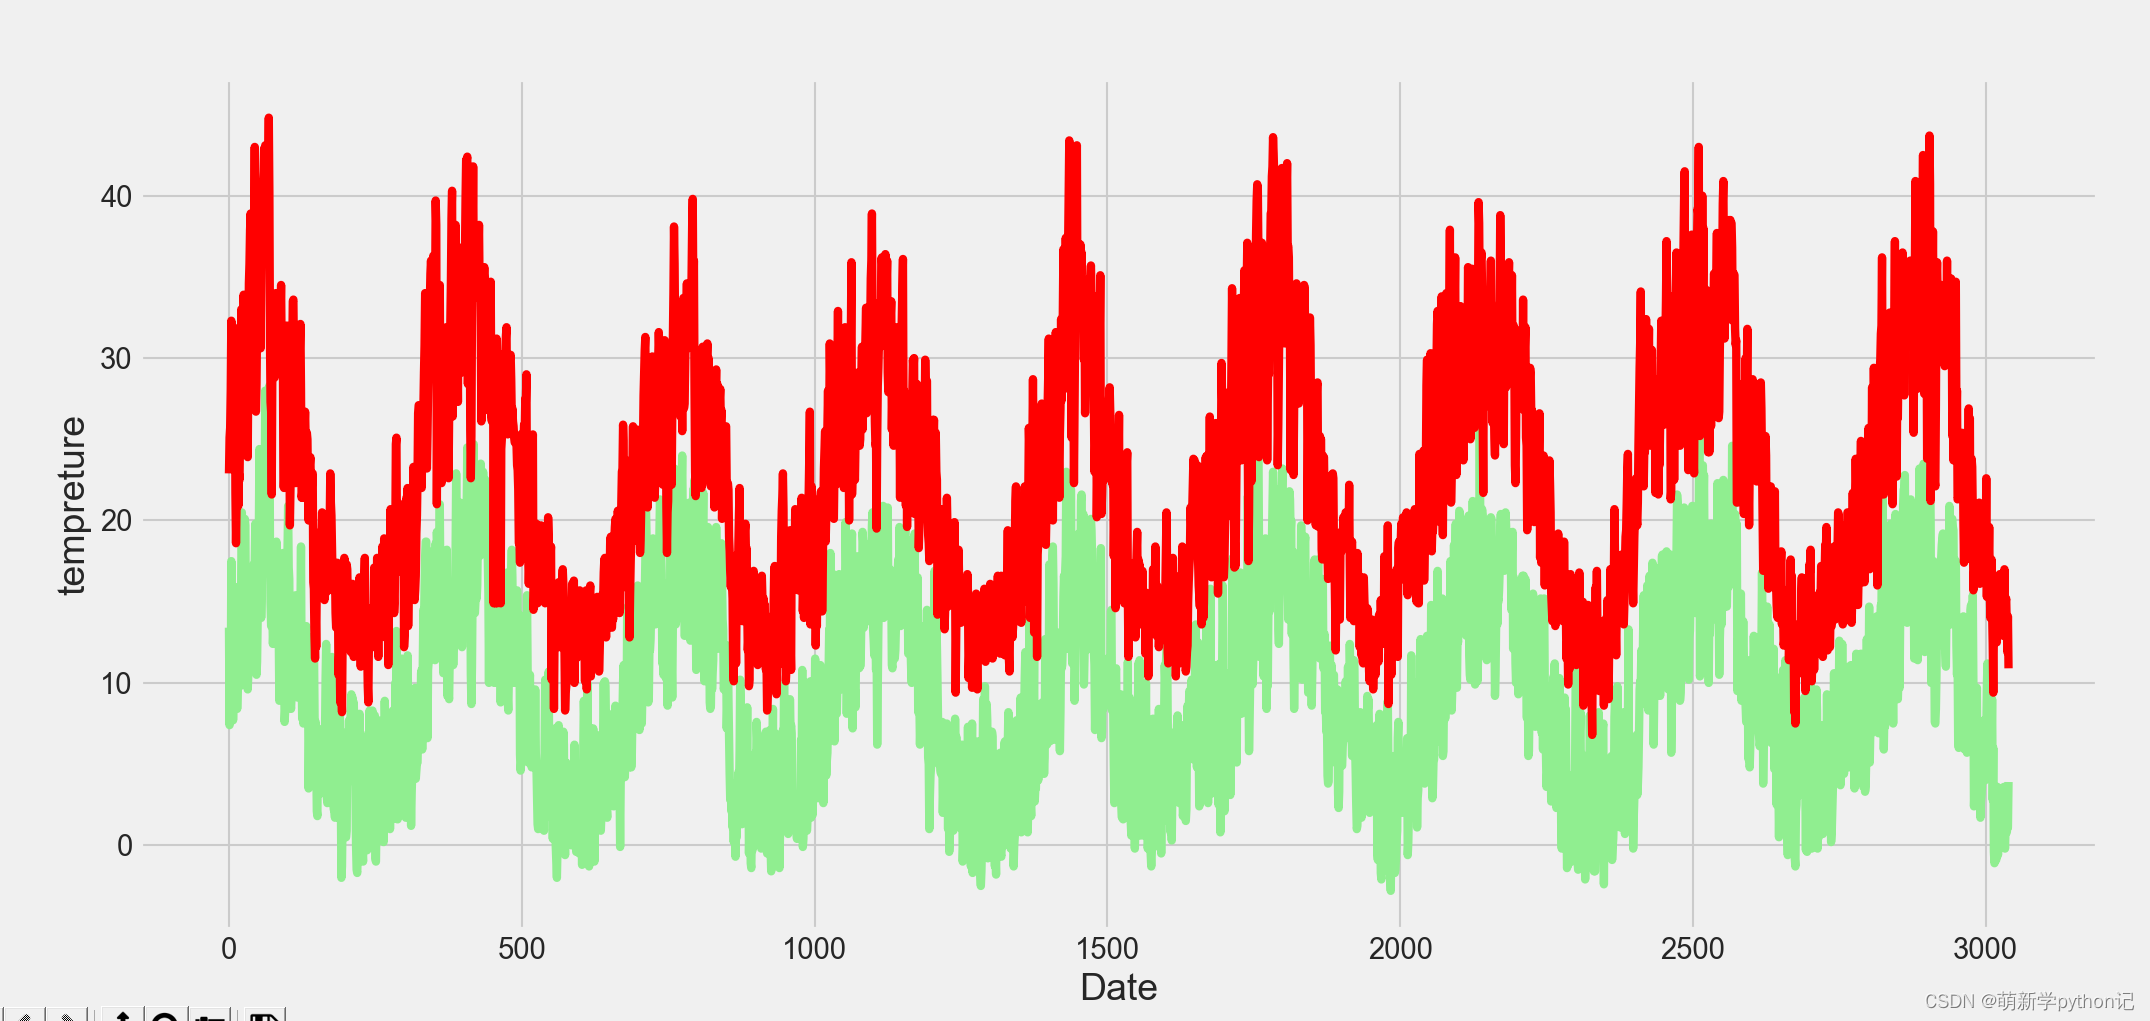
代预测数据的选取:选取奥尔伯里最大最小温度的数据进行预测。
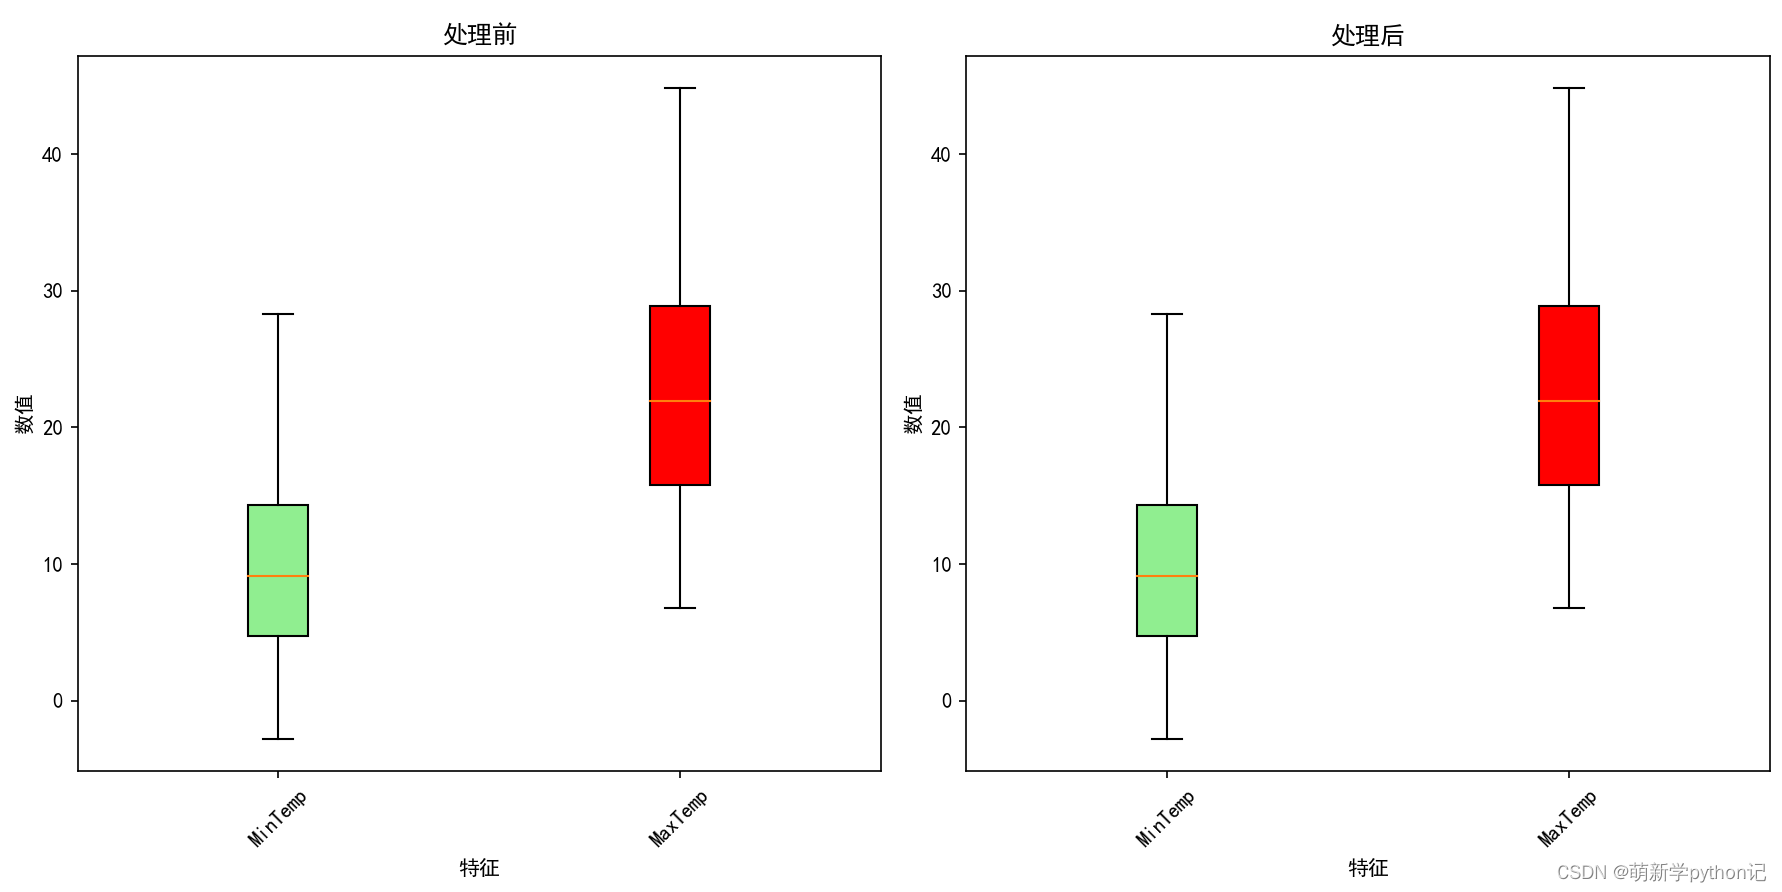
数据预处理:缺失值,异常值,重复值。
异常值处理前后展示:
数据随时间变化展示:
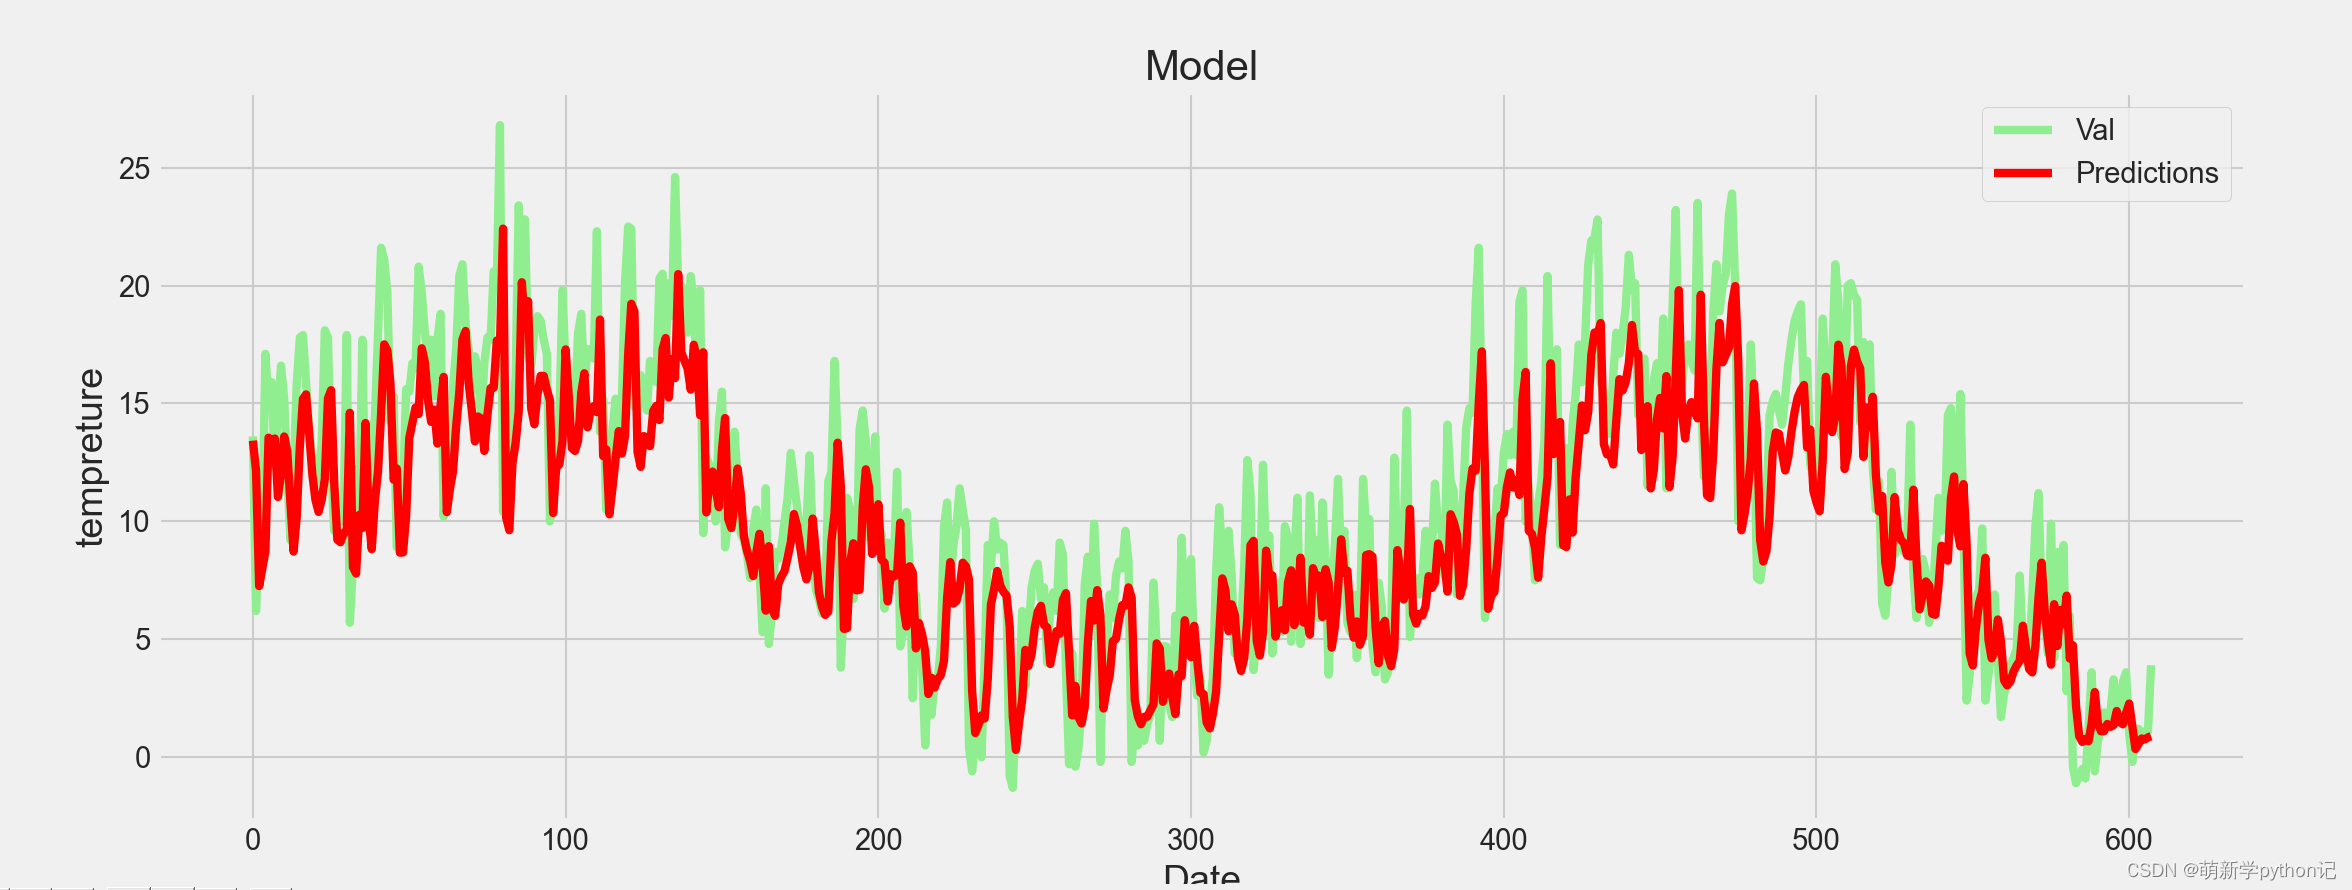
测试值预测结果展示(最大温度的):
5 代码展示
5.1 数据预处理代码
import pandas as pdimport numpy as npimport matplotlib.pyplot as plt# 设置matplotlib参数以支持中文显示plt.rcParams["font.sans-serif"] = "SimHei"plt.rcParams['axes.unicode_minus'] = False# 读取CSV文件train = pd.read_csv("C://Users//86182//Desktop//weatherAUS.csv")# 数据预处理:缺失值众数填充和去重# 对train DataFrame中的每一列使用众数填充缺失值for col in train.columns: if train[col].dtype in ['int64', 'float64']: # 确保只处理数值列 mode_val = train[col].mode().iloc[0] # 获取该列的众数 train[col].fillna(mode_val, inplace=True) # 使用众数填充缺失值train = train.drop_duplicates() # 去除重复行# 提取除前两列之外的所有列名a = list(train.columns)[2:]# 异常值处理:使用IQR方法替换异常值for col in a: q1 = train[col].quantile(0.25) q3 = train[col].quantile(0.75) iqr = q3 - q1 lower_bound = q1 - 1.5 * iqr upper_bound = q3 + 1.5 * iqr train.loc[(train[col] < lower_bound) | (train[col] > upper_bound), col] = train[col].mean()# 绘制箱型图:处理前(这里假设使用原始数据作为对比)和处理后fig, axes = plt.subplots(nrows=1, ncols=2, figsize=(12, 6))bplot1 = axes[0].boxplot(train[a], vert=True, patch_artist=True, meanline=False) # 仅绘制前5个特征作为示例bplot2 = axes[1].boxplot(train[a], vert=True, patch_artist=True, meanline=False)# 颜色填充colors = ['lightgreen', 'red']for ax, bplot in zip(axes, (bplot1, bplot2)): for patch, color in zip(bplot['boxes'], colors): patch.set_facecolor(color) # 图像修饰biaoti = ['处理前', '处理后']for ax, title in zip(axes, biaoti): ax.set_xlabel('特征') ax.set_ylabel('数值') ax.set_title(title, fontsize=12) ax.set_xticklabels(a[:5], rotation=45) # 仅设置前5个特征的标签plt.tight_layout() # 调整子图之间的间距plt.show()# 保存处理后的数据到Excel文件train[a].to_excel("C://Users//86182//Desktop//pythonsjdc.xlsx", index=False)plt.plot(list(train[a[0]]),color=colors[0])plt.plot(list(train[a[1]]),color=colors[1])plt.show()5.2 LSTM 代码
import pandas as pdimport numpy as npimport matplotlib.pyplot as pltimport seaborn as snsfrom keras.models import Sequentialfrom keras.layers import Dense, LSTMfrom sklearn.preprocessing import MinMaxScalersns.set_style('whitegrid')plt.style.use("fivethirtyeight")df = pd.read_excel("C://Users//86182//Desktop//pythonsjdc.xlsx")# Show teh dataColumns=df.columns#图像绘制plt.figure(figsize=(15,7))# plt.title('tempreture')plt.plot(df[Columns[0]],color="lightgreen")plt.plot(df[Columns[1]],color="red")plt.xlabel('Date', fontsize=18)plt.ylabel('tempreture', fontsize=18)plt.show()#提取第一列数据dataset = np.array(df[Columns[0]])#数据集划分因为是关于时间的属于故需验证时间点划分training_data_len = int(np.ceil( len(dataset) * 0.8))print(training_data_len)# 标准化数据(0,1)reshape_dataset=dataset.reshape(len(dataset),1)#适配标准化格式数组scaler = MinMaxScaler(feature_range=(0,1))scaled_data = scaler.fit_transform(reshape_dataset)#创建训练集train_data = scaled_data[0:int(training_data_len), :]print(train_data)x_train = []y_train = []for i in range(30, len(train_data)): x_train.append(train_data[i - 30:i, 0]) y_train.append(train_data[i, 0]) if i <= 31:#展示格式 print(">>>>>>") print(x_train) print("!!!!") print(y_train)# 把数据转换为numpy arraysx_train, y_train = np.array(x_train), np.array(y_train)# reshape数组格式为了适配构建的LSTM要去格式x_train = np.reshape(x_train, (x_train.shape[0], x_train.shape[1], 1))# x_train.shape# 建立LSTM模型model = Sequential()model.add(LSTM(58, return_sequences=True, input_shape= (x_train.shape[1], 1)))model.add(LSTM(34, return_sequences=False))model.add(Dense(25))model.add(Dense(1))# 编制模型model.compile(optimizer='adam', loss='mean_squared_error')# 训练模型model.fit(x_train, y_train, batch_size=1, epochs=1)#创建测试集#预测第training_data_len要该点前三十(向后看的步长)个的数据test_data = scaled_data[training_data_len-30:, :]x_test = []y_test = reshape_dataset[training_data_len:, :]for i in range(30, len(test_data)): x_test.append(test_data[i - 30:i, 0])x_test = np.array(x_test)x_test = np.reshape(x_test, (x_test.shape[0], x_test.shape[1], 1))# 使用构建的模型预测测试集predictions = model.predict(x_test)predictions = scaler.inverse_transform(predictions)# RMSE评价模型rmse = np.sqrt(np.mean(((predictions - y_test) ** 2)))print("该测试集的EMSE为{}".format(rmse))# 预测数据可视化plt.figure(figsize=(16,6))plt.title('Model')plt.xlabel('Date', fontsize=18)plt.ylabel('tempreture', fontsize=18)plt.plot(y_test,color="lightgreen")plt.plot(predictions,color='red')plt.legend([ 'Val', 'Predictions'], loc='upper right')#loc(图例在图像的那个位置)plt.show()