Hey, 又到了一年两度的MATLAB更新时刻,MATLAB R2024b正式版发布啦!,直接来看看有哪些我认为比较有意思的更新吧!
1 小提琴图
天塌了,我这两天才写了个半小提琴图咋画,MATLAB 官方就出了小提琴图绘制方法。
小提琴图基础画法
ydata = randn(100,3);violinplot(ydata)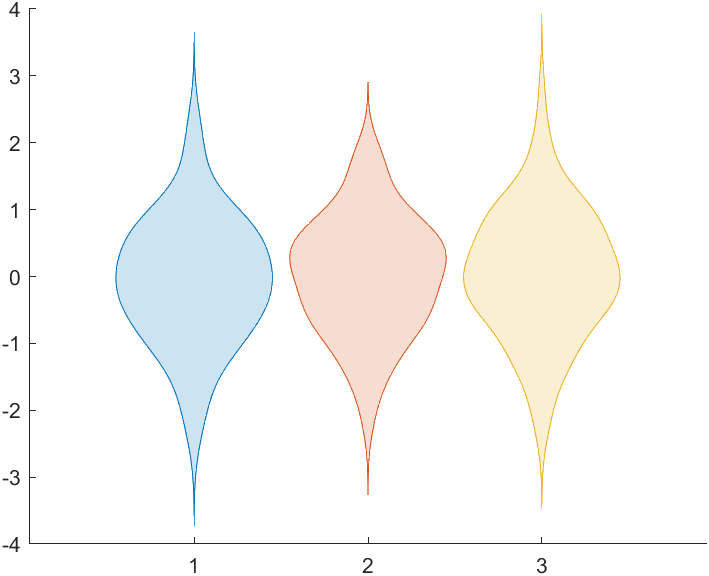
分组数据绘制小提琴图
比如100个数据,前20个分到第一组,中间50个分到第二组,最后30个分到第三组
ydata = randn(100, 1);xgroupdata = categorical(repelem(["group1";"group2";"group3"], [20,50,30]));violinplot(xgroupdata, ydata)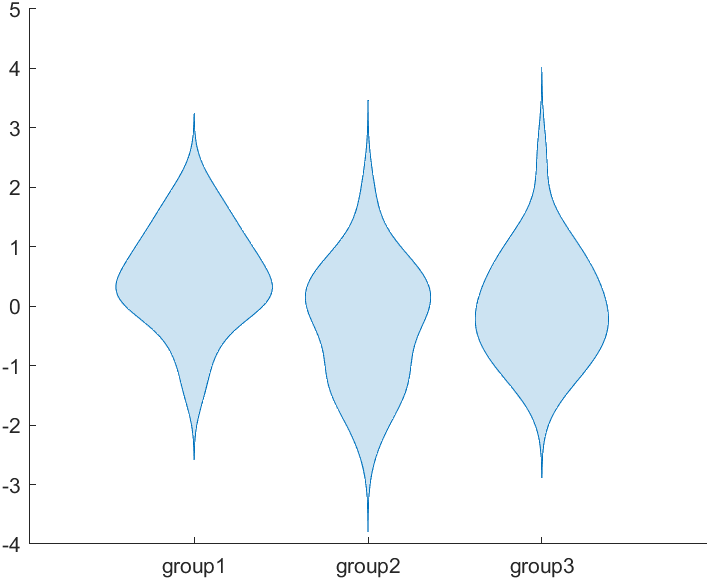
对比小提琴图
ydata1 = randn(100,1);ydata2 = randn(100,1)+5;xgroupdata1 = categorical(repelem(["group1";"group2"],[90,10]));xgroupdata2 = categorical(repelem(["group3";"group4"],[25,75]));tbl = table(xgroupdata1,xgroupdata2, ... ydata1,ydata2,VariableNames=["X1","X2","Y1","Y2"]);figureviolinplot(tbl,"X1","Y1")一组数据一种分类方式:
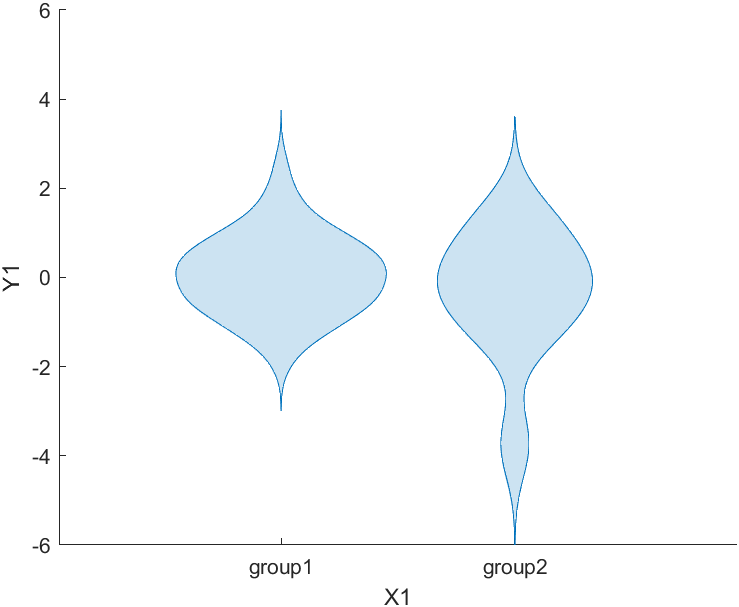
figureviolinplot(tbl,"X1",["Y1","Y2"])两组数据(橘色一组蓝色一组)同一种分类方式:
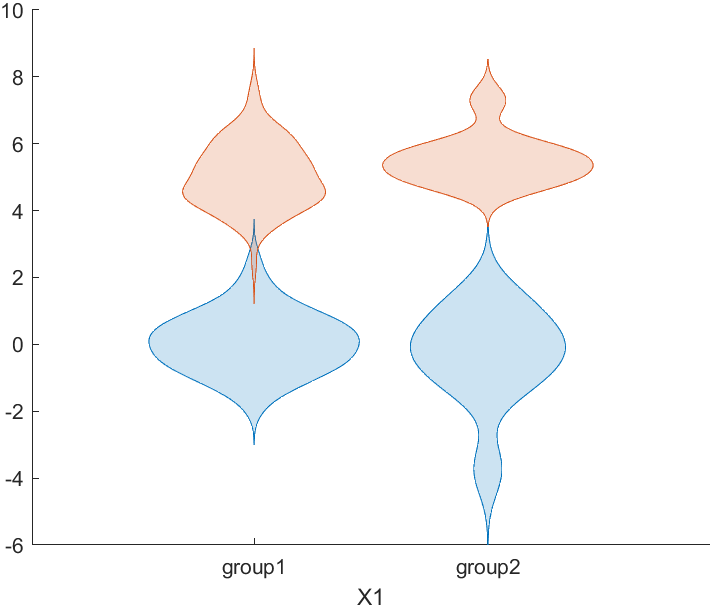
figureviolinplot(tbl,["X1","X2"],"Y1")一组数据两种(橘色一种蓝色一种)分类方式:
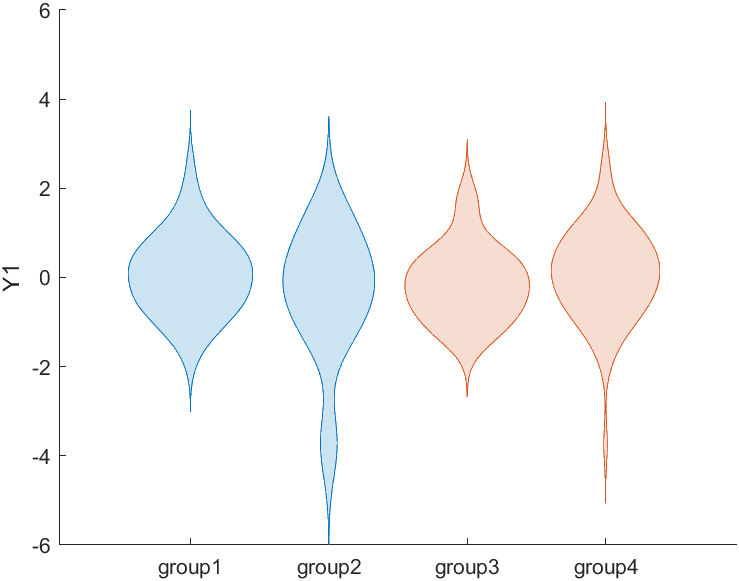
figureviolinplot(tbl,["X1","X2"],["Y1","Y2"])两组数据两种分类方式:
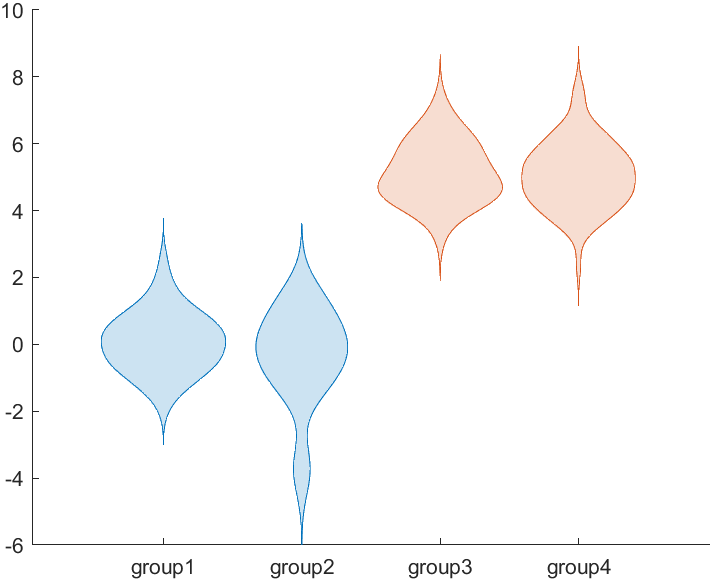
位置和颜色分组数据
ydata = randn(100,1);xgroupdata = categorical(repelem(["group1";"group2";"group3"], [20;50;30]));cgroupdata = categorical(repelem(["a";"b";"a";"b";"c";"d";"e"], [10;10;25;25;10;10;10]));violinplot(xgroupdata, ydata, GroupByColor = cgroupdata)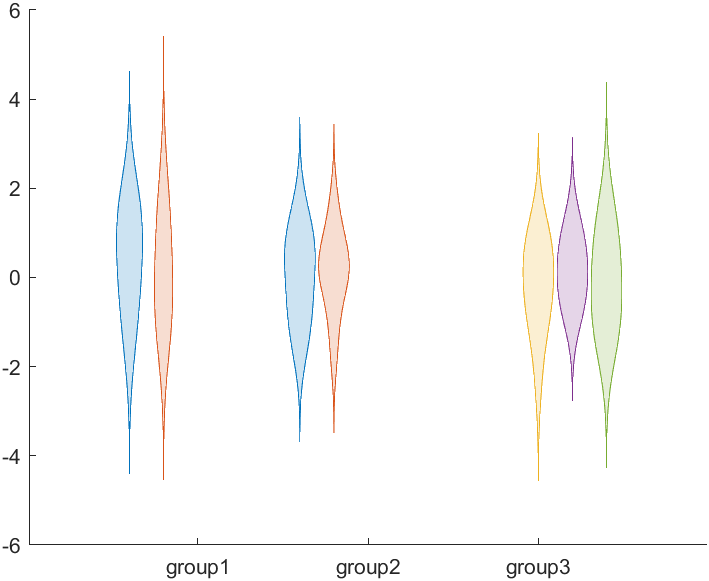
半小提琴图
左右版本:
ydata1 = randn(100,1);ydata2 = [randn(25,1)+2; randn(75,1)+5];xgroupdata1 = repelem([1;2], [50;50]);xgroupdata2 = repelem([1;2], [25;75]);violinplot(xgroupdata1, ydata1, DensityDirection = "positive")hold onviolinplot(xgroupdata2, ydata2, DensityDirection = "negative")legend("ydata1","ydata2")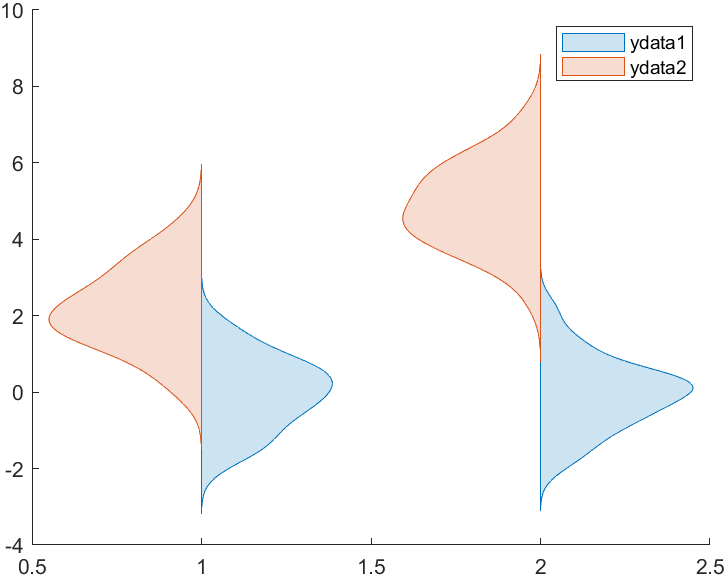
上下版本:
violinplot(xgroupdata1,ydata1,Orientation="horizontal",DensityDirection="positive")hold onviolinplot(xgroupdata2,ydata2,Orientation="horizontal",DensityDirection="negative")legend("ydata1","ydata2")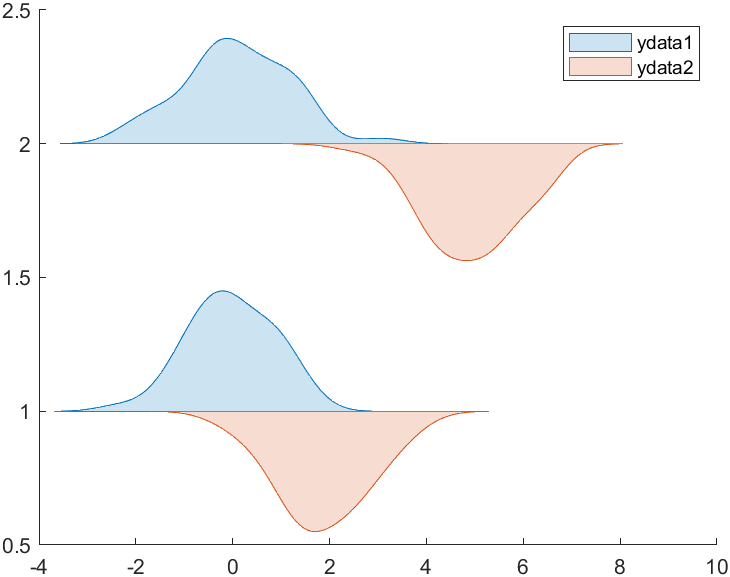
2 新版罗盘图
估计老版本compass函数会在未来被删掉,新出的罗盘图函数叫compassplot:
rho = [1 3 2 2];theta = [0 pi/4 3*pi/4 5*pi/4];compassplot(theta,rho)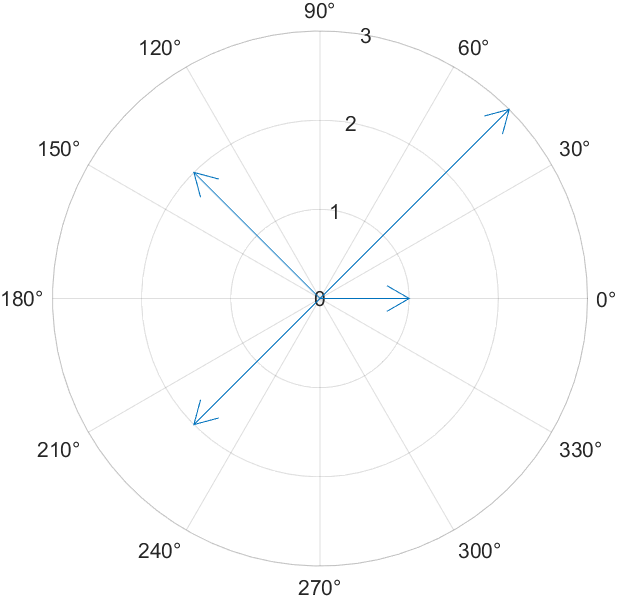
[a,b] = meshgrid(-2:2);Z = a + b*1i;compassplot(Z)
3 无限延伸的平面
constantplane函数,这个用来画示意图还是非常有用的:
XYZ = rand([500,3]);B= XYZ(:,1) < .5;hold onscatter3(XYZ(B, 1), XYZ(B, 2), XYZ(B, 3), 15, 'filled')scatter3(XYZ(~B, 1), XYZ(~B, 2), XYZ(~B, 3), 15, 'filled')constantplane("x", .5 , FaceAlpha = 0.5);view(3)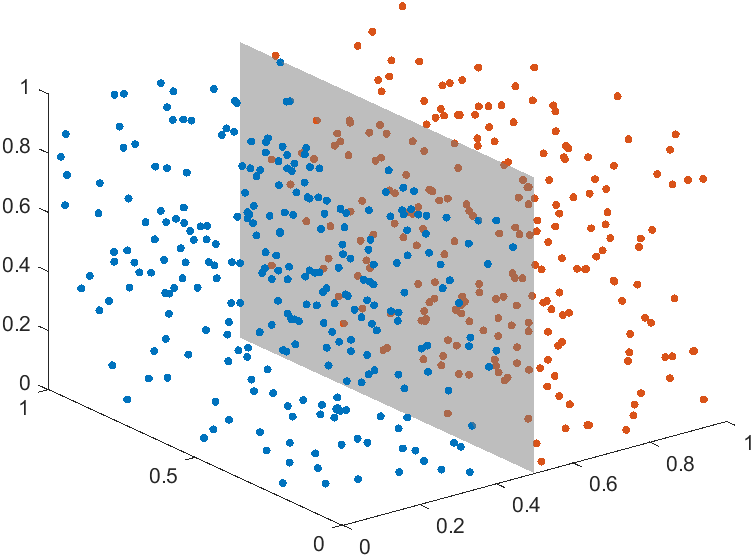
4 图标的宽度
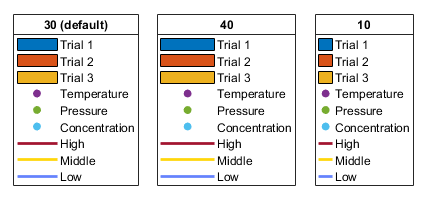
使用图例的IconColumnWidth属性可以控制图标的宽度
x = [1 3 4 3 1 0];y = [0 0 2 4 4 2];hold onfill(x,y,'cyan','FaceAlpha',0.3)fill(x+2,y,'magenta','FaceAlpha',0.3)fill(x+1,y+2,'yellow','FaceAlpha',0.3) lgdHdl = legend();lgdHdl.IconColumnWidth = 5;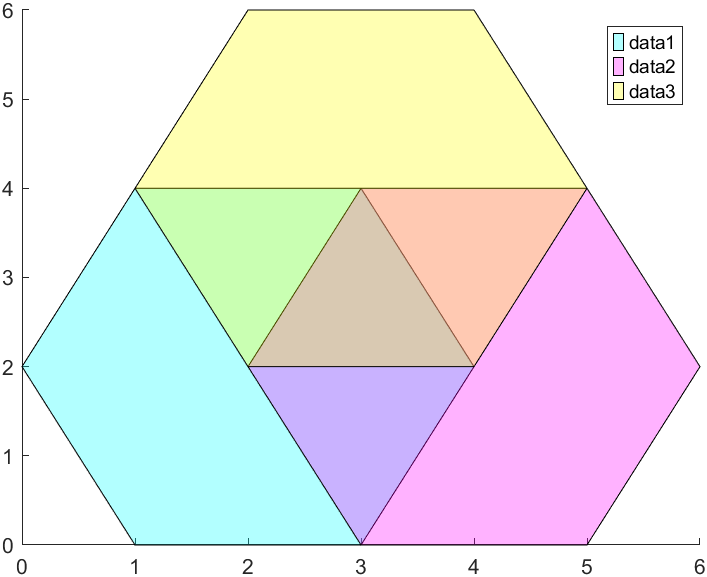
5 饼图和甜甜圈图引入other项
cats = categorical([ "Glazed" "Jelly" "Jelly" "Jelly" , ... "Sugar" , "Sugar" , "Plain" , "" , "" , "" , "" ,]); donutchart (cats,LabelStyle= "name" )以前未定义项目不会显示,现在会显示为other:
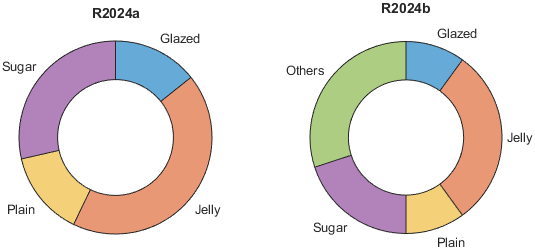
可通过以下方式关闭:
donutchart(cats,LabelStyle="name",ShowOthers="off")6 柱状图标签
标签终于彻底变成柱状图一部分:
x = [1 2 3];vals = [2 3 6; 11 23 26; 2 4 23];b = bar(x,vals);b(1).Labels = b(1).YData;b(2).Labels = b(2).YData;b(3).Labels = b(3).YData;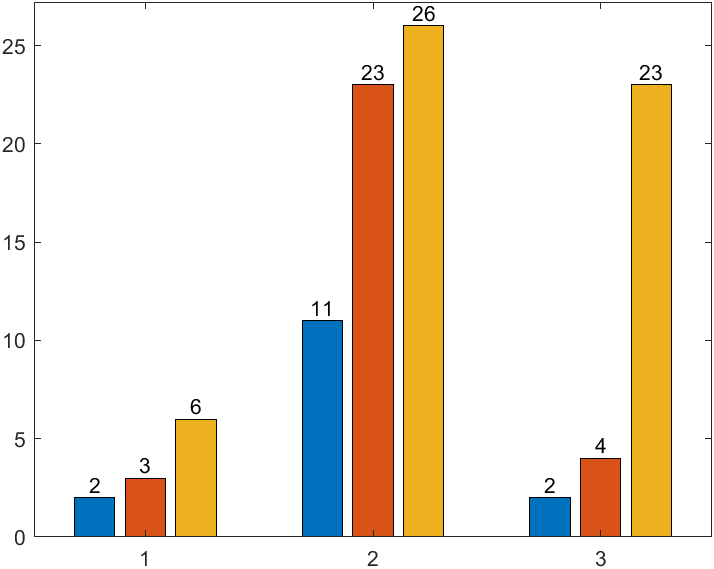
b(1).LabelLocation = "end-inside";b(2).LabelLocation = "end-inside";b(3).LabelLocation = "end-inside";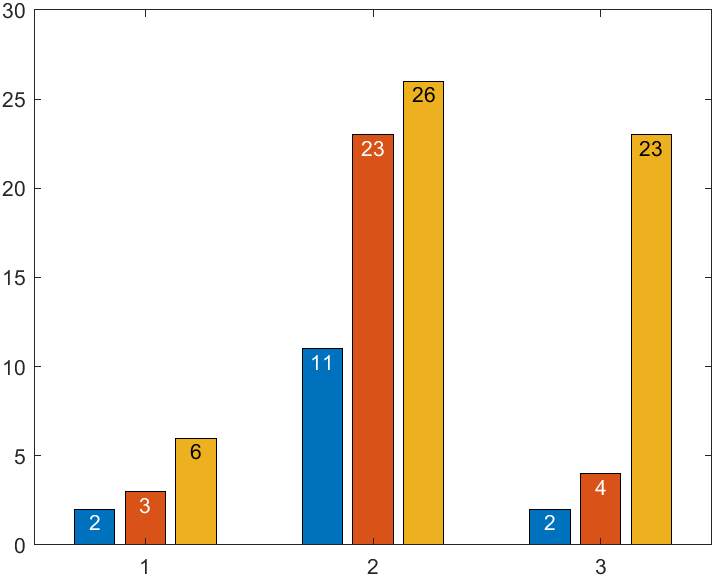
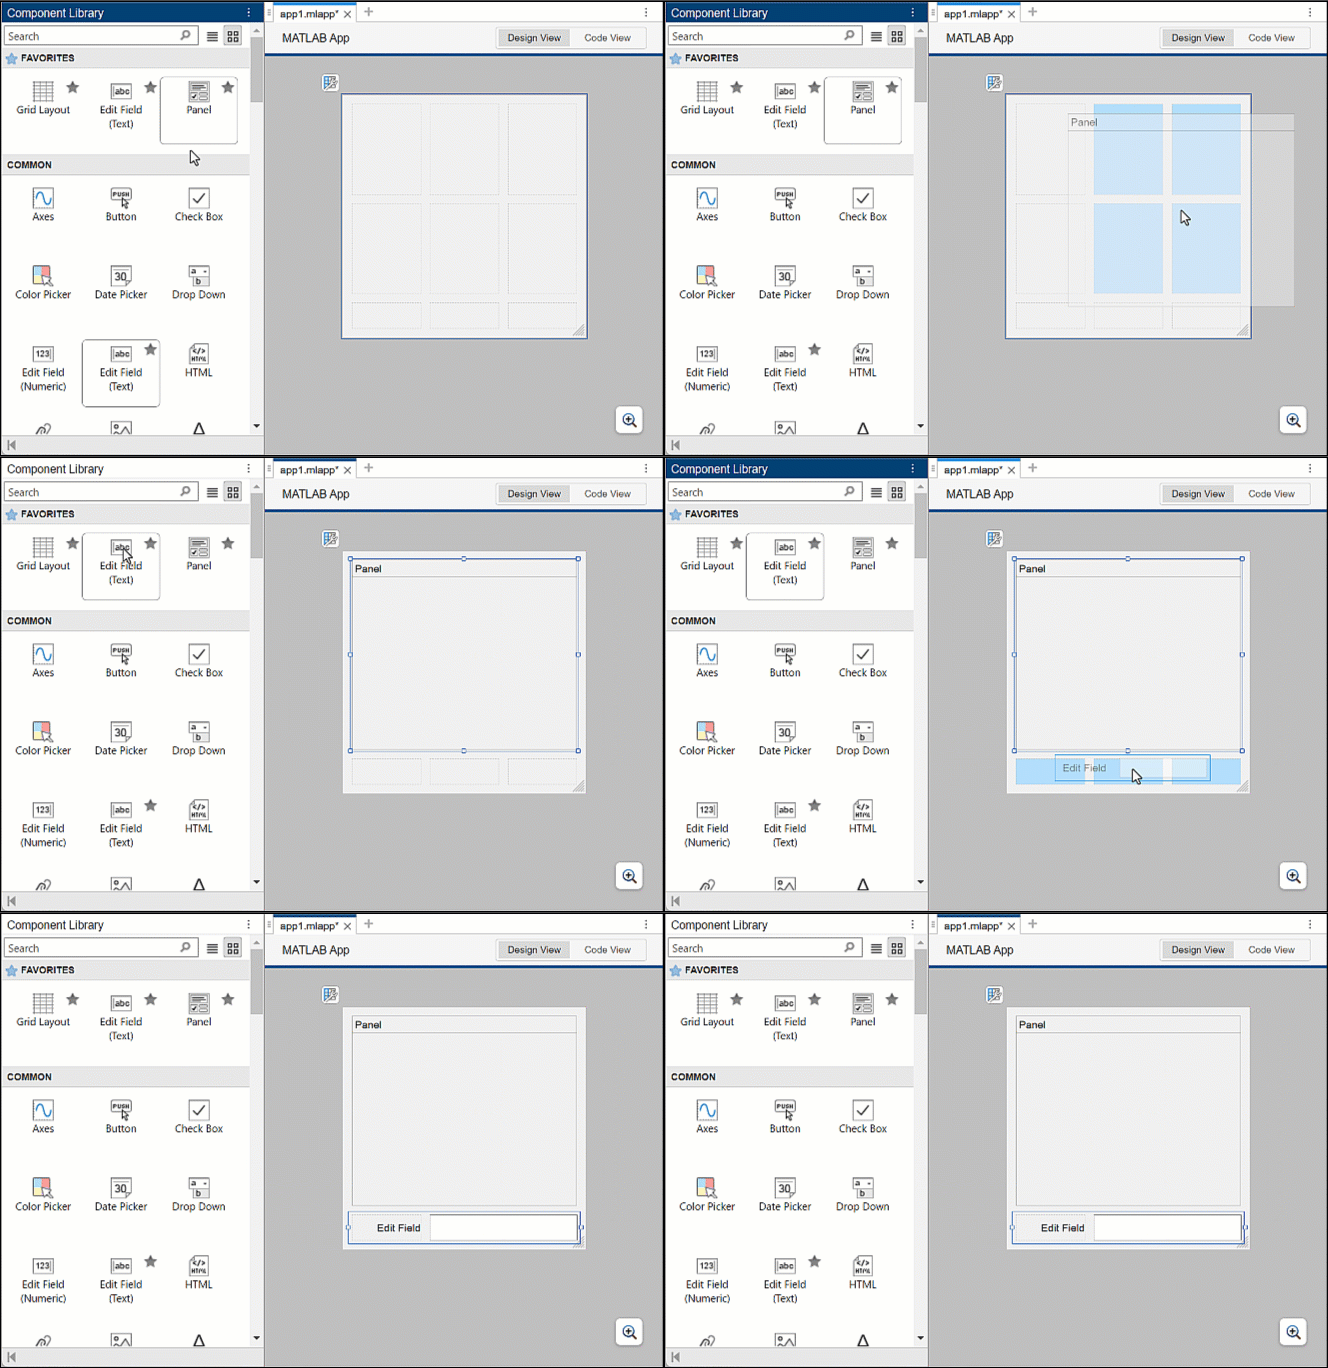
7 更方便构建跨多个网格单元UI组件
8 MATLAB测试版新桌面
可以测试包括深色主题、更新的布局和扩展的搜索功能,去以下fileexchange链接下载:
https://www.mathworks.com/matlabcentral/fileexchange/119593-new-desktop-for-matlab-beta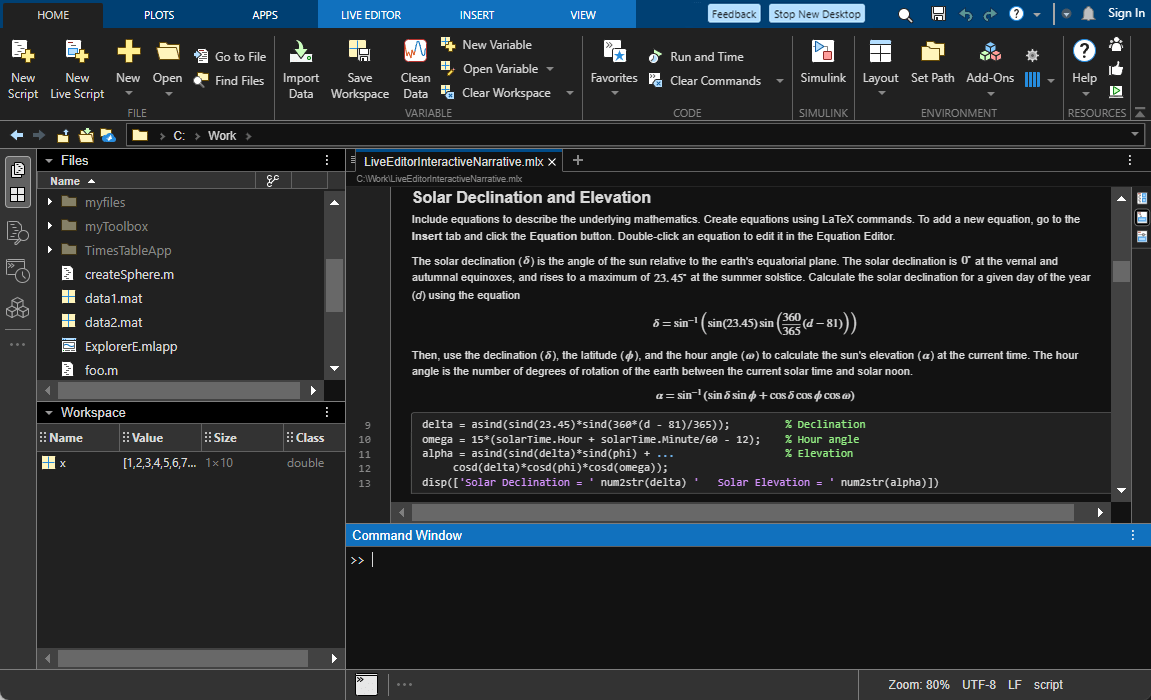
9 实时编辑器范围滑块

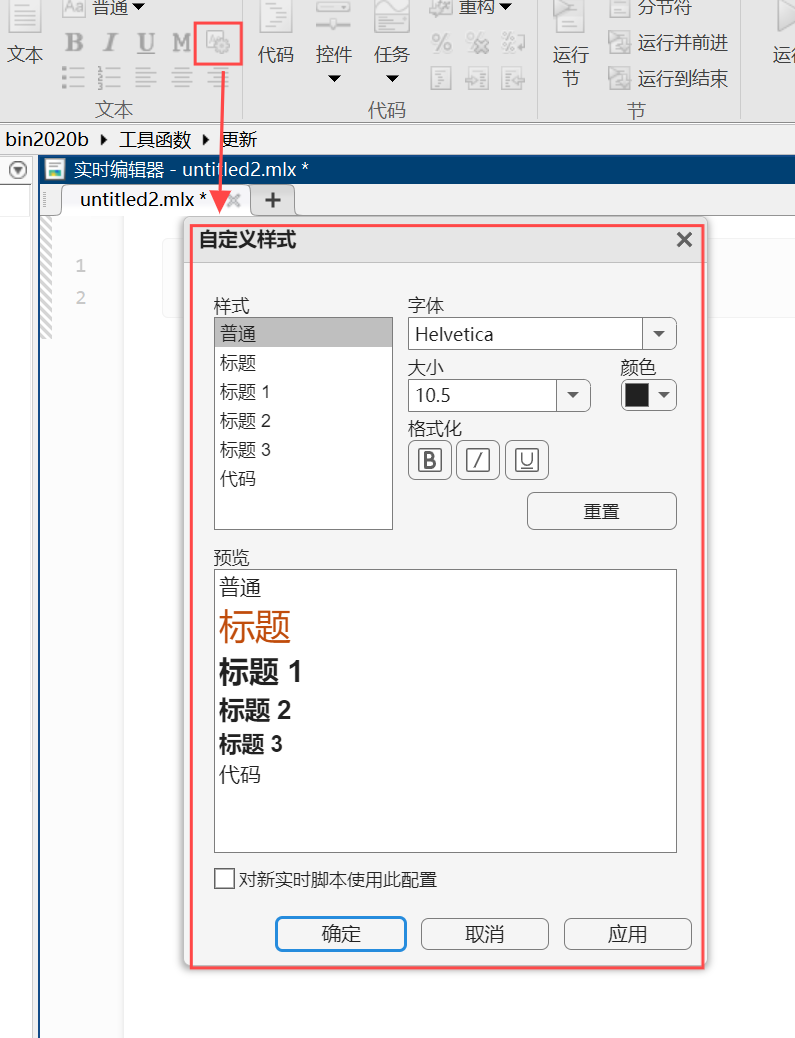
10 实时编辑器修改代码字体
11 找出在范围内的数据
A = [1 3 5 7 9];TF = isbetween(A,2,7)% TF = 1x5 logical array% 0 1 1 1 0val = A(TF)% val = 1×3% 3 5 7以前则需要:
TF = A >= 2 & A <= 712 去除NaN值和异常值
A = [1 3 NaN 6 NaN];R = rmmissing(A)% R = 1×3% 1 3 6以前则需要
R = A(~isnan(A))异常值可以使用rmoutliers函数去除。
13 检测数据是否近似
直接问数据相等与否会因为有误差给出否的结果,现在可以问数据是否相似:
A = sin(3/4*pi);B = 1/sqrt(2);A==B% ans = logical% 0isapprox(A,B)% ans = logical% 1后言
篇幅问题很多更新不再赘述,其中包括帮助函数help返回的信息格式会更加统一,还有一个对初学者很友好的更新,就是报错的具体位置会用^这个符号进行标注,大概这样:

然后简单叙述一下关于文件处理的部分此外比如可以使用unzip解压有密码的压缩包,可以使用readdictionary和writedictionary读取json文件,python和MATLAB字典可以互相使用:
此外在工具箱方面主要有以下更新
5G Toolbox - 探索候选 6G 波形生成DSP HDL Toolbox - 使用交互式 DSP HDL IP Designer 应用程序定制、配置 DSP 算法并生成 HDL 代码和验证组件Simulink Control Design - 设计和实施非线性和数据驱动的控制技术,例如滑动模式和迭代学习控制System Composer - 编辑子集视图;使用活动和序列图描述系统行为更多详细信息请见:
https://www.mathworks.com/help/releases/R2024b/matlab/release-notes.htmlhttps://www.mathworks.com/products/new_products/latest_features.html