最新版Golang pprof使用
?具体实践:
Go调试神器pprof使用教程Golang线上内存爆掉问题排查(pprof)Github地址:https://github.com/ziyifast/ziyifast-code_instruction/tree/main/go-demo/go-pprof
引入pprof:import _ “net/http/pprof”
引入pprof包,监听某个端口即可
一旦服务器启动,pprof 就开始收集关于程序的性能数据,包括 CPU 使用情况、内存使用情况、阻塞事件、锁竞争、goroutine 和线程统计信息等。当客户端请求 pprof 的路由时,pprof 会根据请求的类型提供相应的数据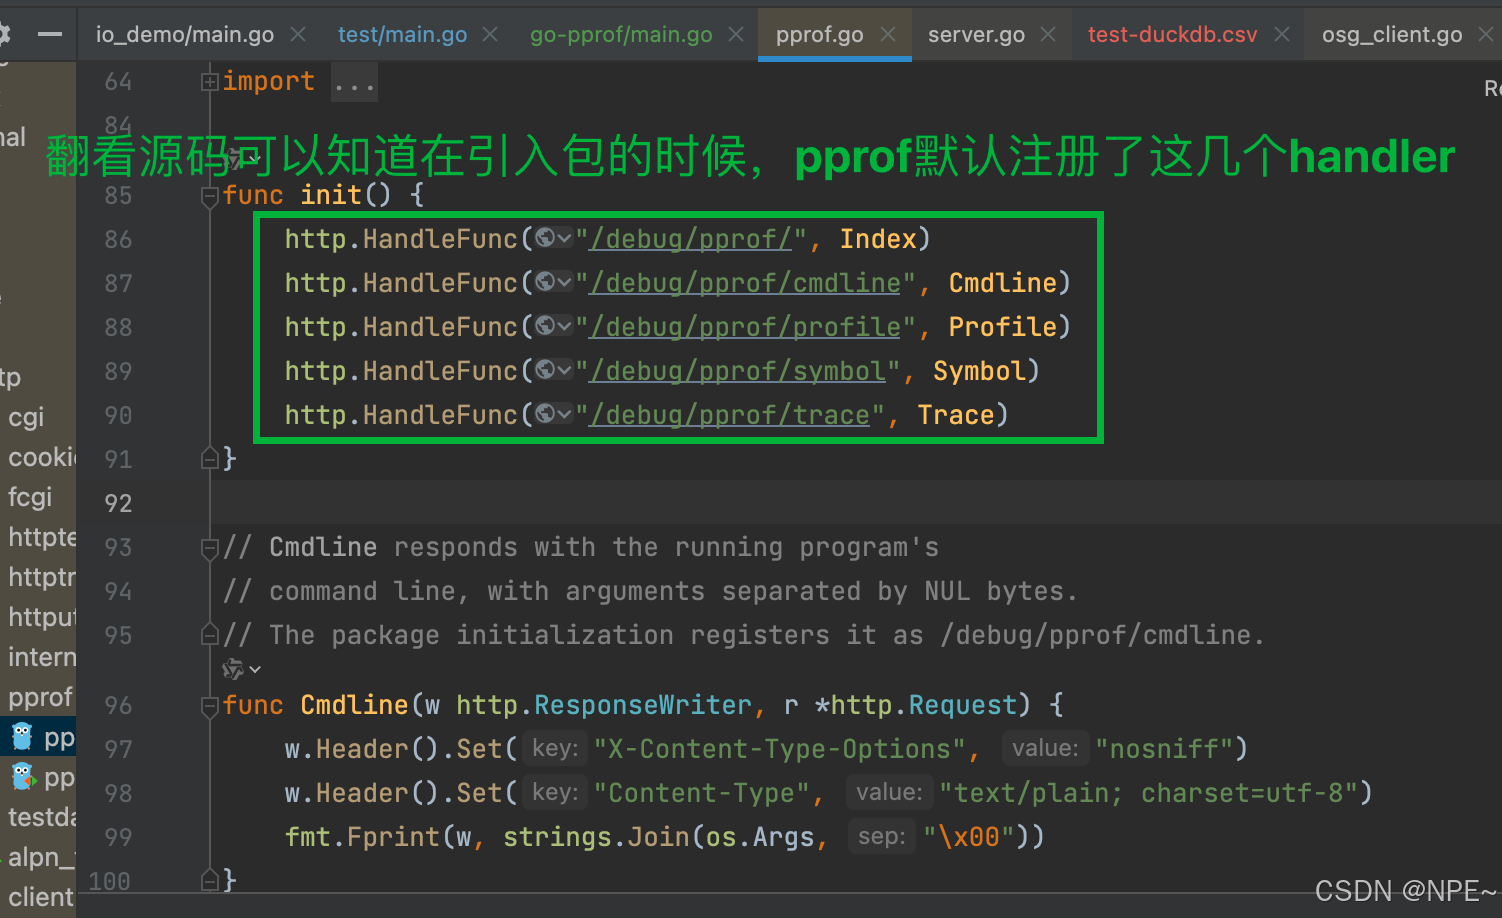
package mainimport "net/http"import _ "net/http/pprof"func main() {http.ListenAndServe(":8080", nil)select {}}文字版pprof信息:http://ip:port/debug/pprof
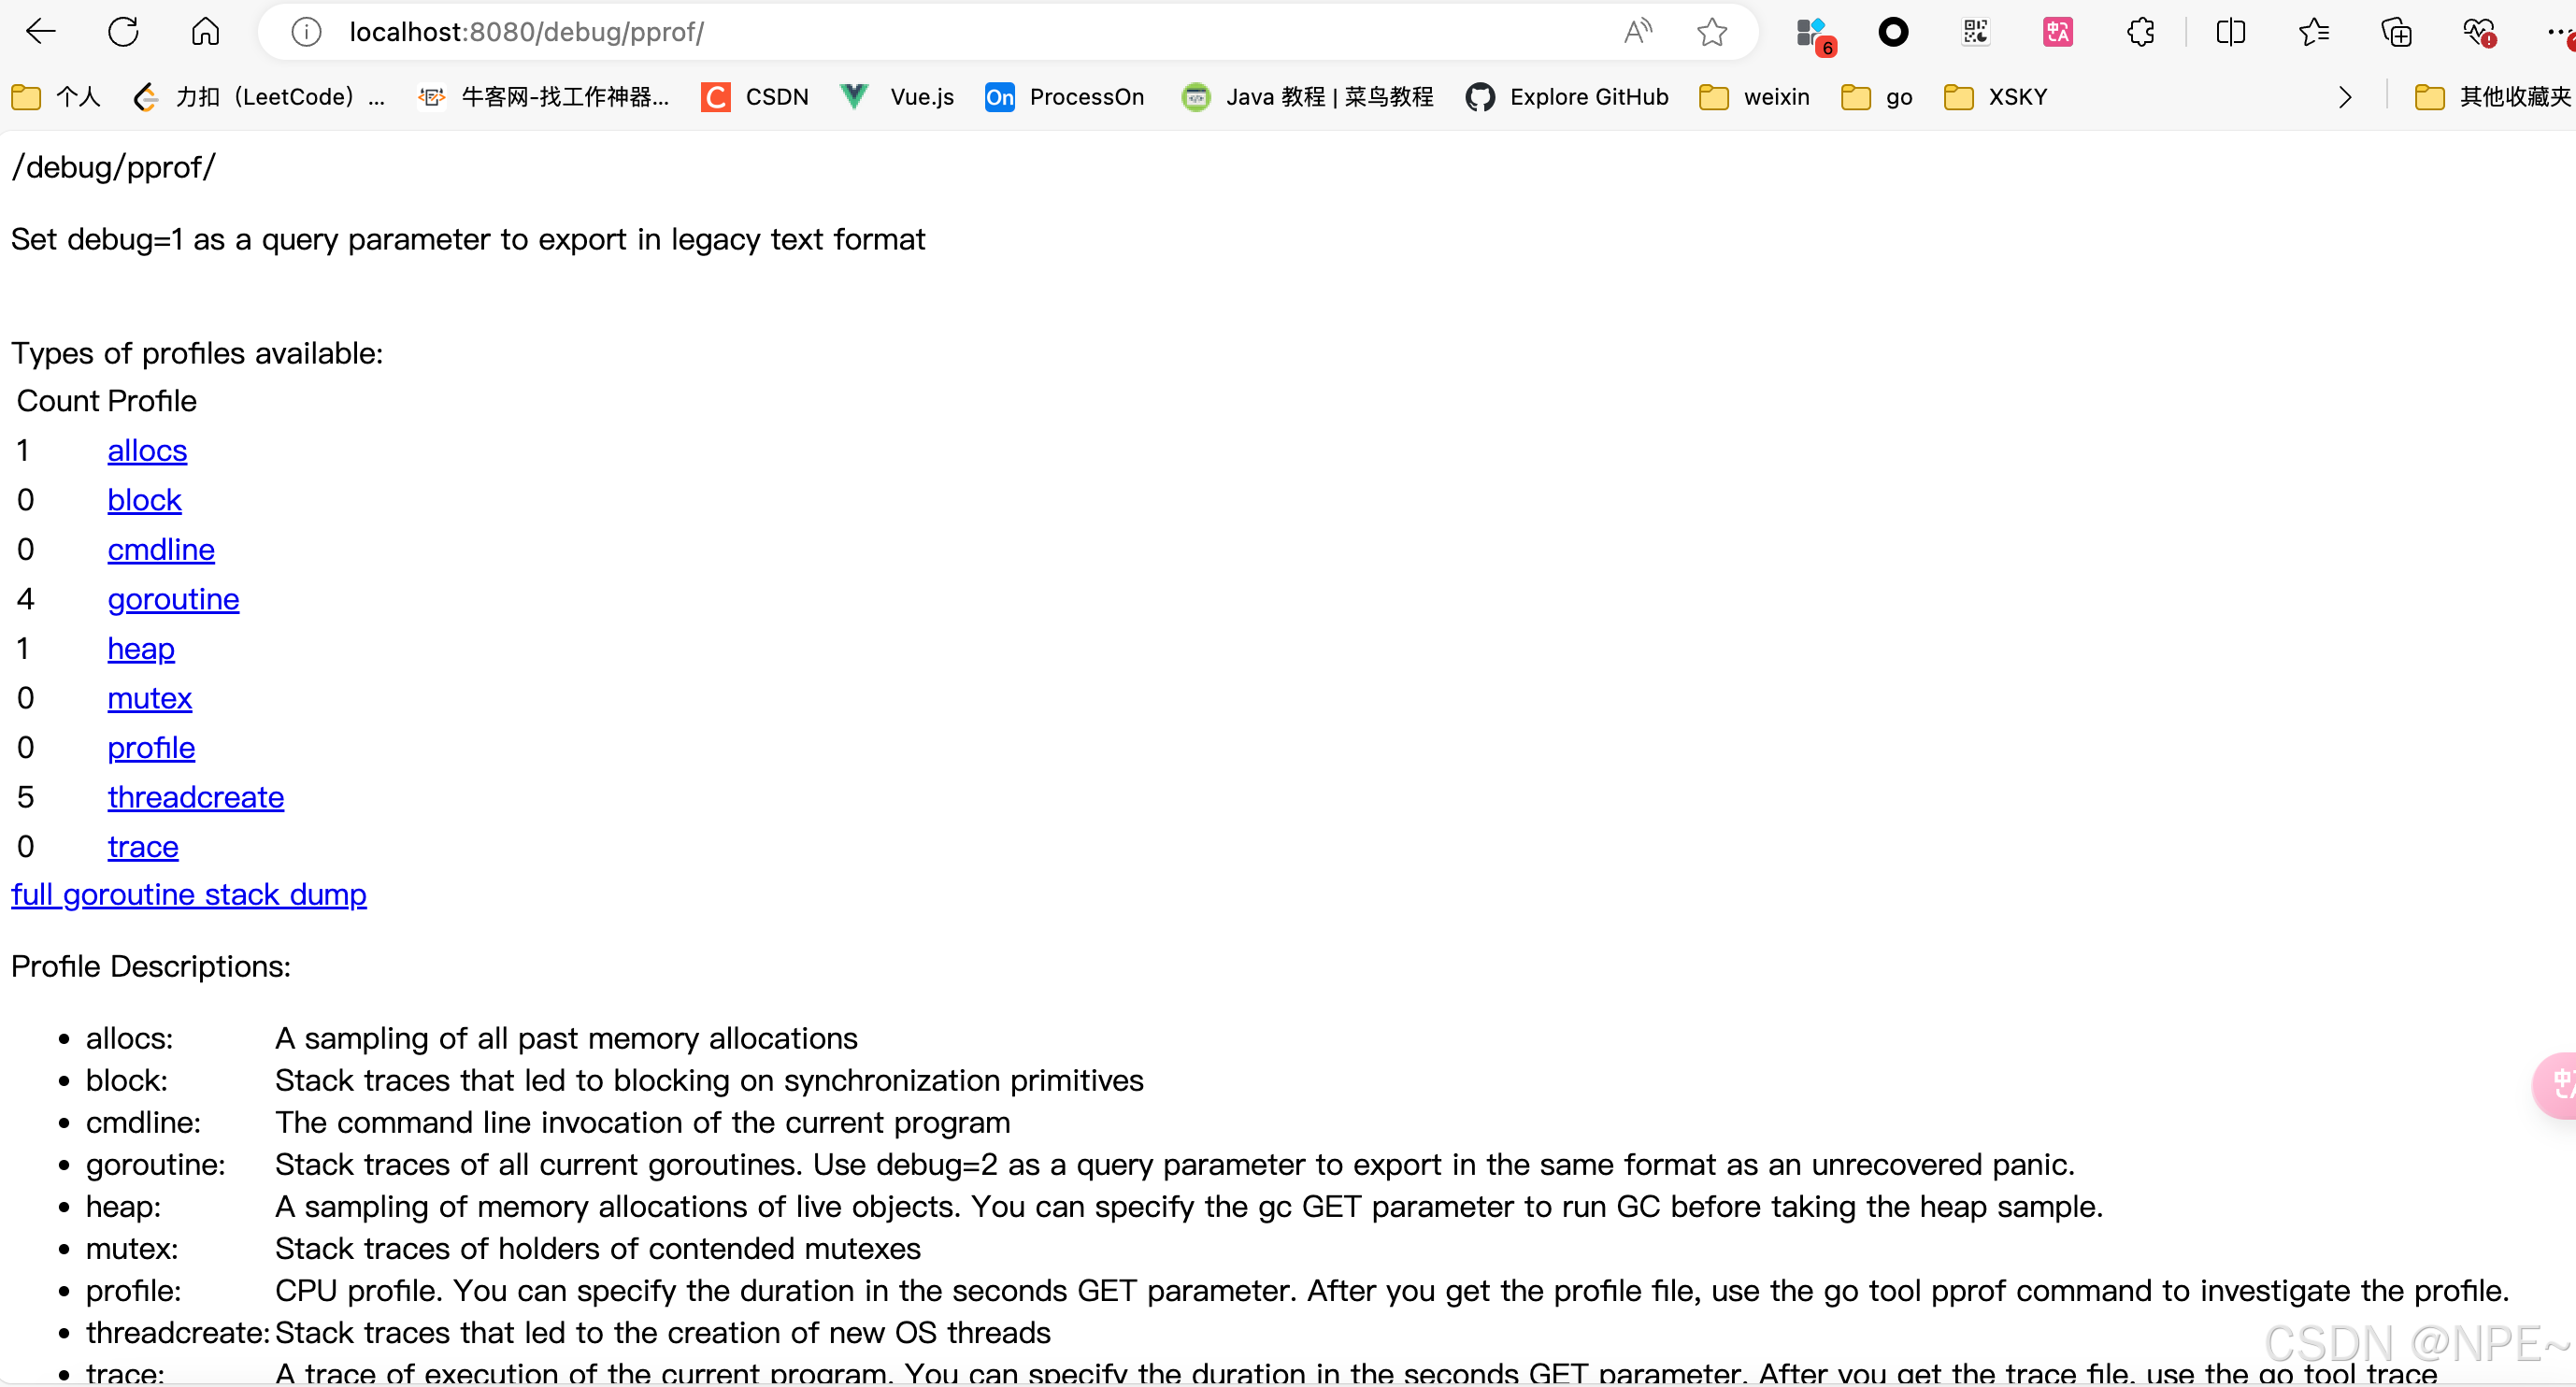
引入包之后,启动服务,浏览器访问http://ip:port/debug/pprof,即可查看文字版pprof信息。
比如我本地监控8080,我浏览器访问http://localhost:8080/debug/pprof:
图形化查看:go tool pprof -http=“0.0.0.0:8089” http://127.0.0.1:8080/debug/pprof/goroutine
如果觉得文字版不直观,我们也可以本地再通过pprof工具启一个web端口,以图形化方式观察:
//监听远程pprof信息,并将其转换为图形化//我这里拿本地127.0.0.1做演示。监听远程pprof,将127.0.0.1更换为对应ip即可go tool pprof -http="0.0.0.0:8089" http://127.0.0.1:8080/debug/pprof/goroutine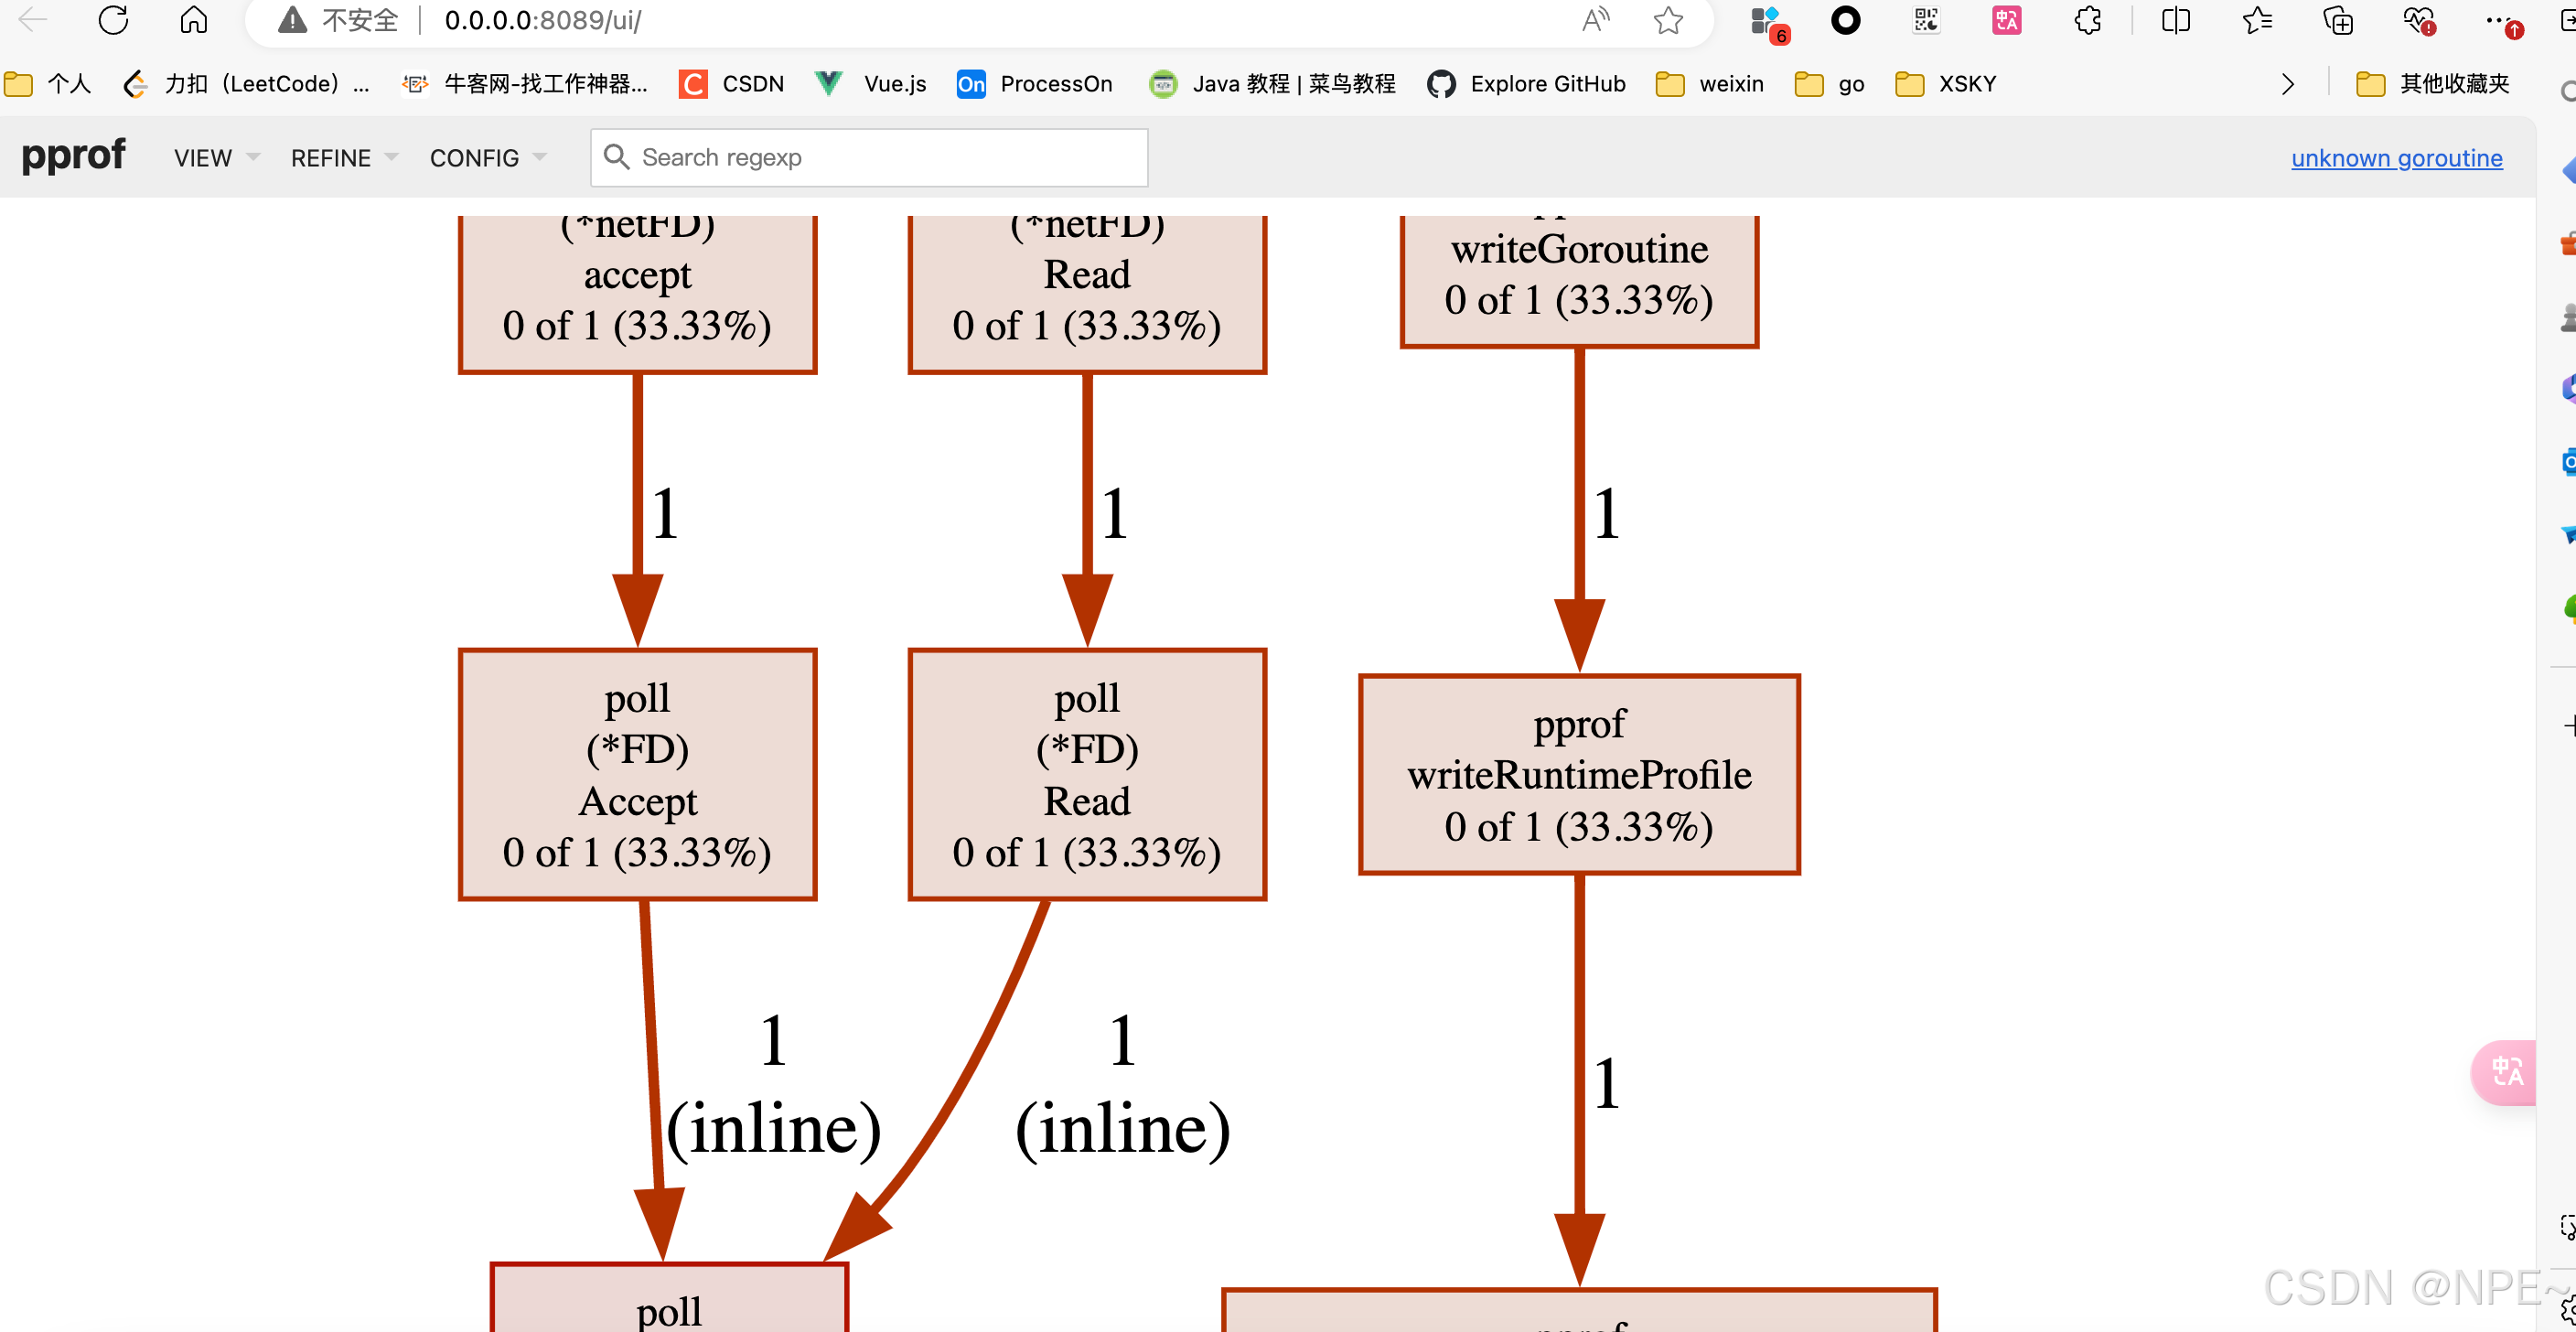
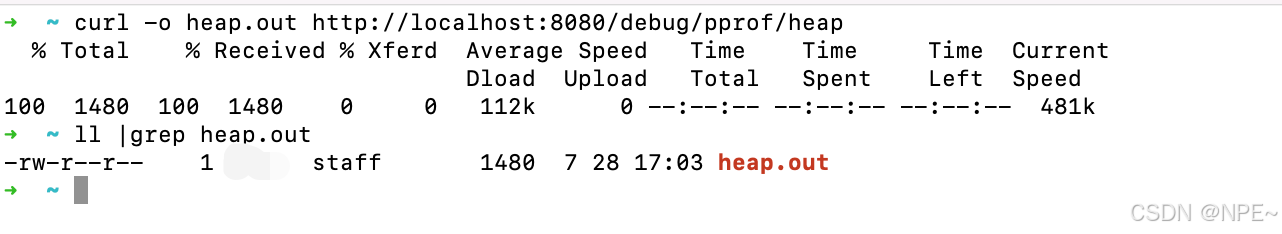
下载pprof信息到文件:curl -o heap.out http://IP:Port/debug/pprof/heap
//采样pprof信息到文件,以采集heap信息为例://curl -o heap.out http://IP:Port/debug/pprof/heapcurl -o heap.out http://localhost:8080/debug/pprof/heap下载pprof heap信息为heap.out文件:
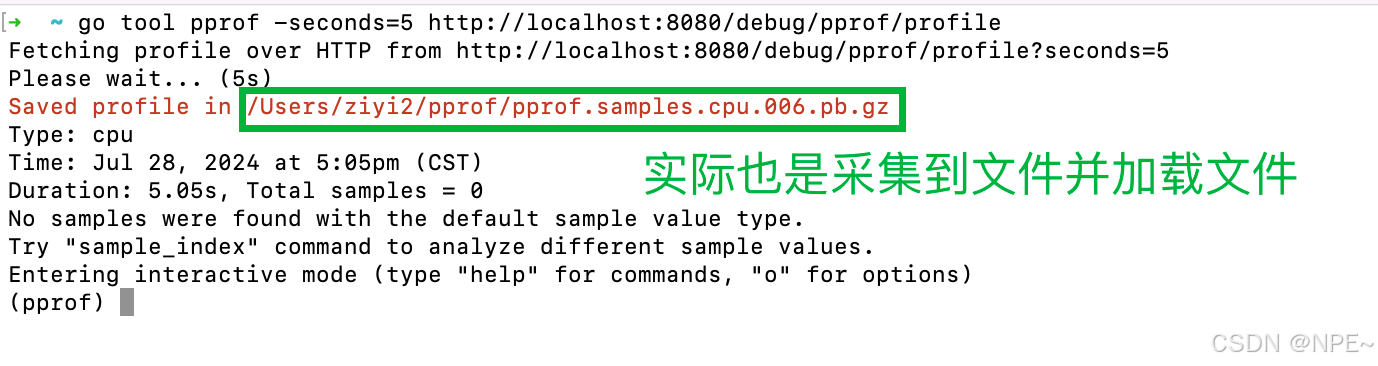
直接抓取pprof信息并分析:go tool pprof -seconds=5 http://localhost:8080/debug/pprof/profile
//采样pprof信息并进入pprof命令行go tool pprof -seconds=5 http://localhost:8080/debug/pprof/profile采集cpu信息并分析:
本地加载pprof文件:go tool pprof heap.out
//go tool pprof 文件名go tool pprof heap.out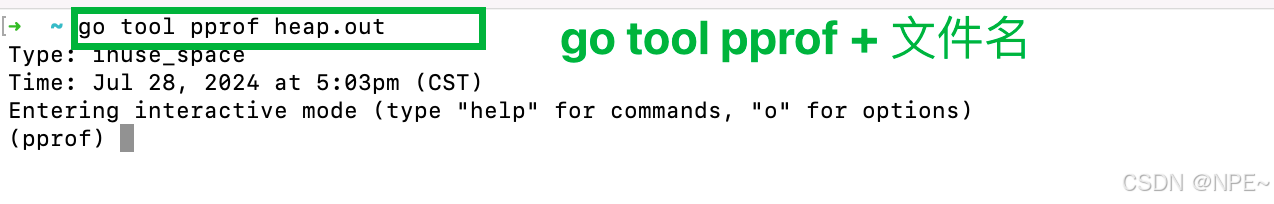
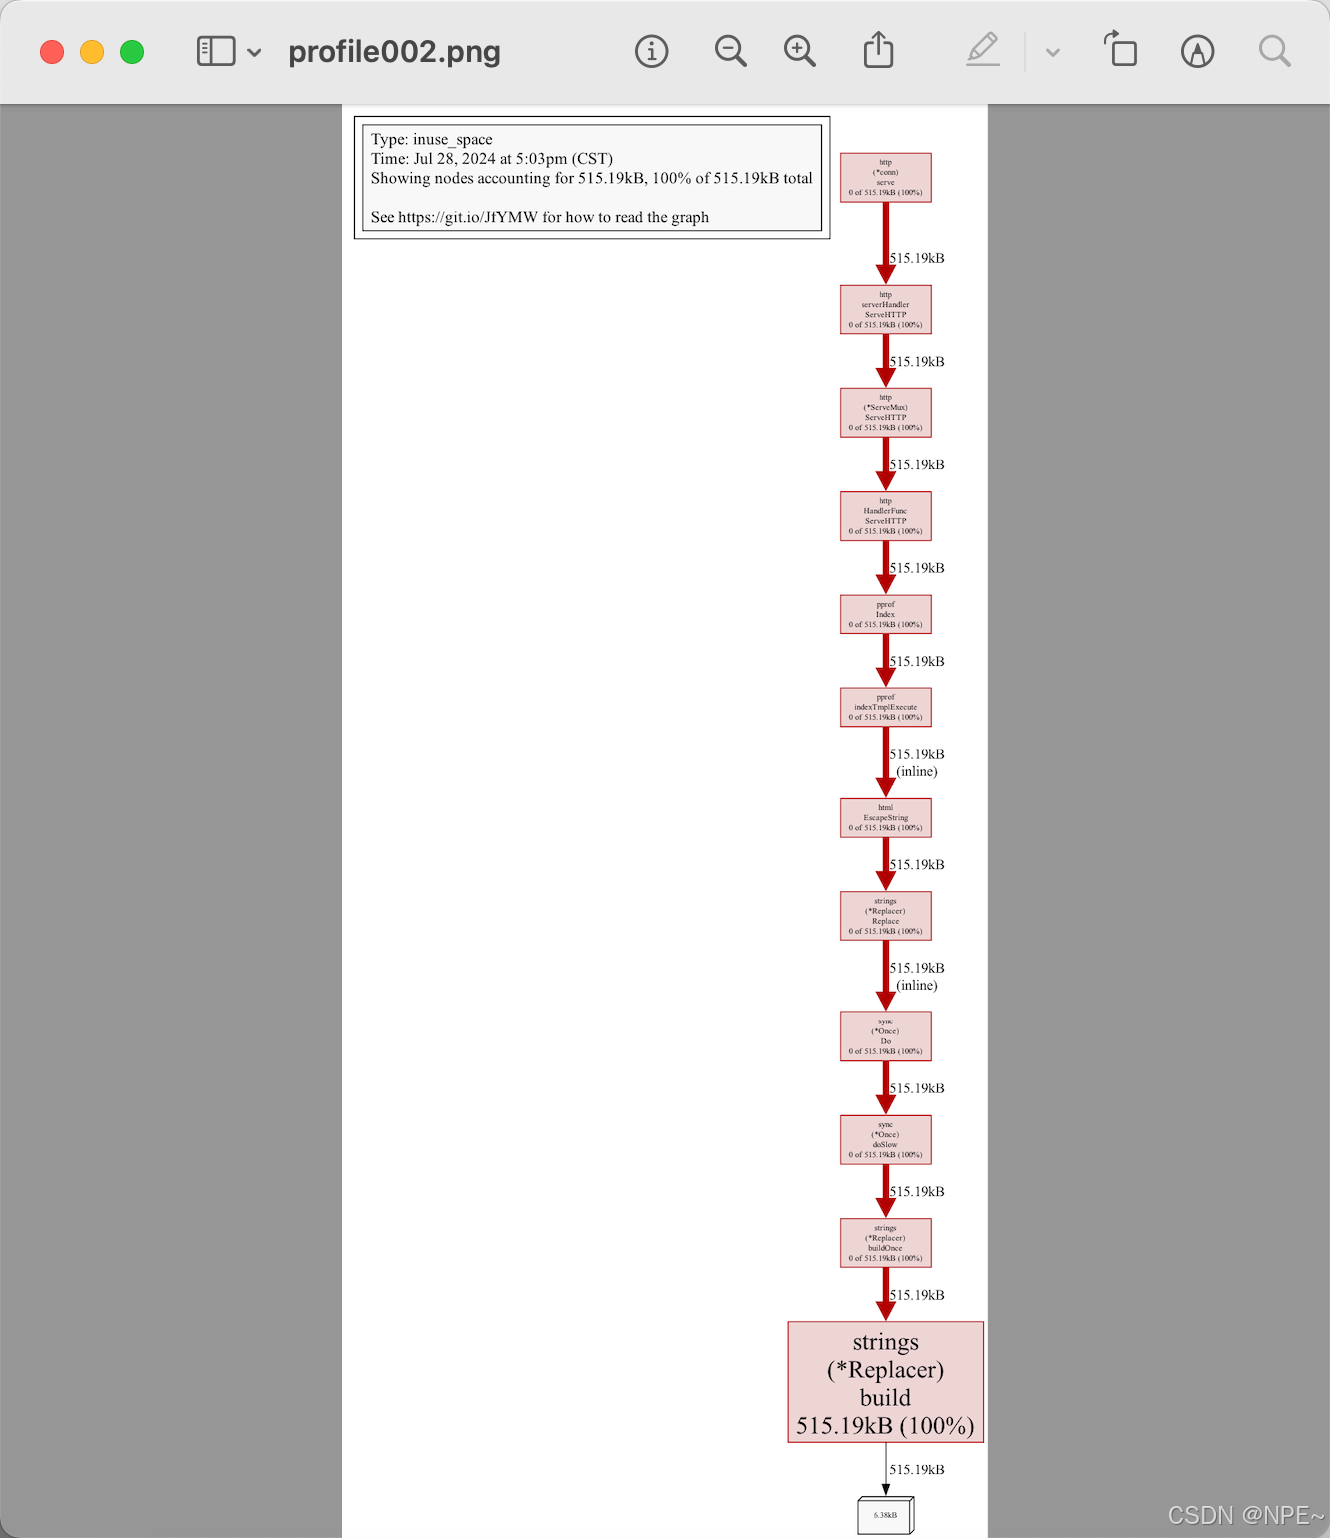
保存pprof为图片:png、svg
//命令行进入pprofgo tool pprof heap.out//导出png图片(导出svg,输入svg即可)png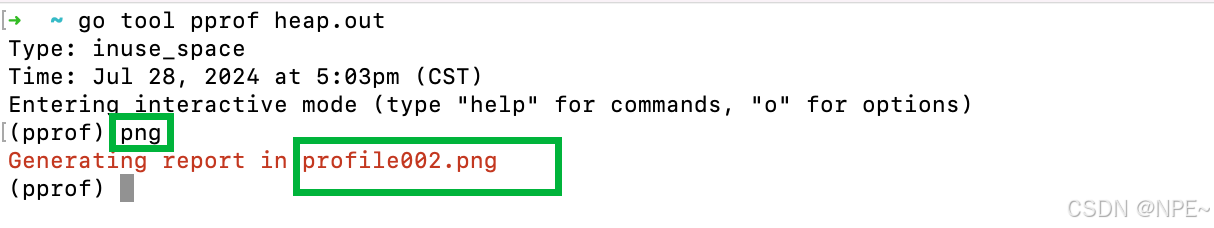
top查看占用情况、list查看详情
以获取内存为例:
flat:当前函数分配的内存,不包含它调用其他函数造成的内存分配flat%:当前函数分配内存占比sum%:自己和前面所有的flat%累积值cum:当前函数及当前函数调用其他函数的分配内存的汇总cum%:这个函数分配的内存,以及它调用其他函数分配的内存之和//命令行进入pprofgo tool pprof heap.out//top 5,查看占用前5的函数top 5//list + 函数名,查看函数详情(具体是哪个位置占用较高)list http.HandlerFunc.ServeHTTP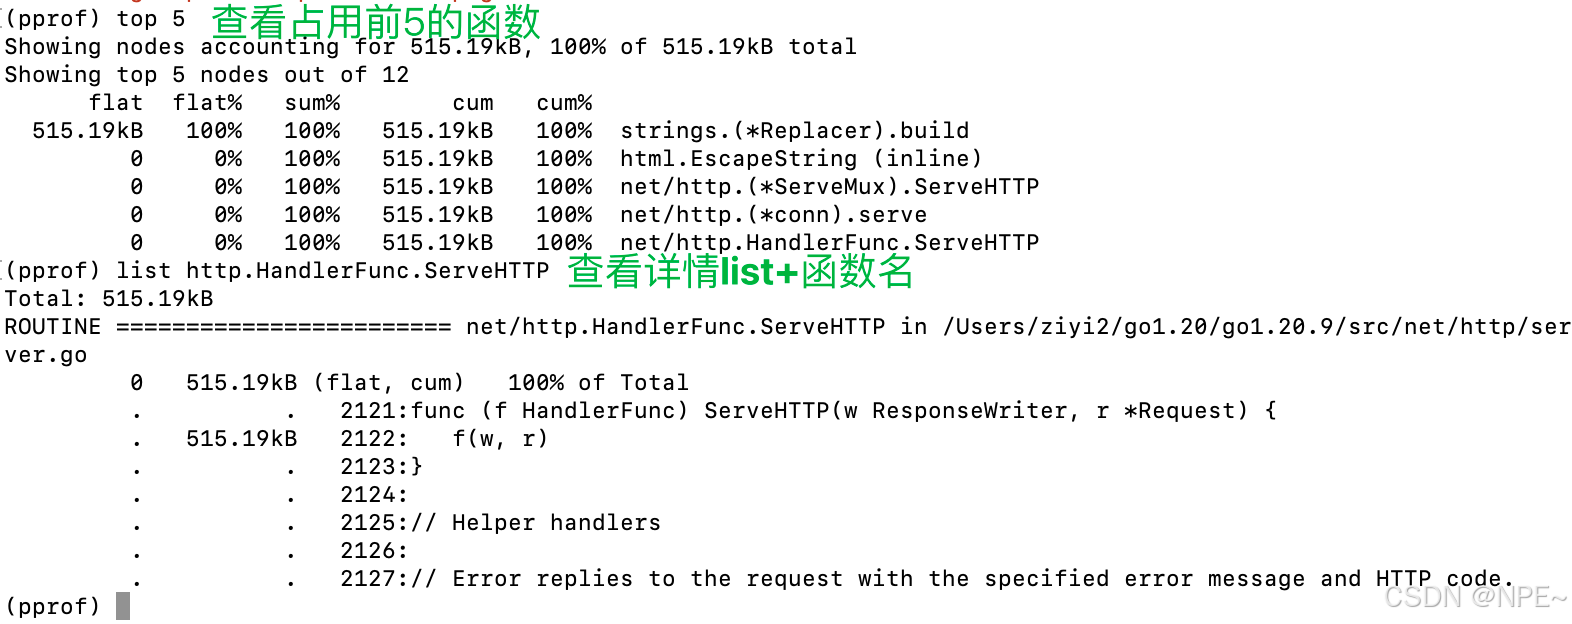
参数解析
详情请见:https://blog.csdn.net/weixin_45565886/article/details/137158092
allocs:内存分配,历史累计
allocs: A sampling of all past memory allocations【所有内存分配,历史累计】
block:导致阻塞的堆栈记录,历史累计
block: Stack traces that led to blocking on synchronization primitives【导致阻塞同步的堆栈,历史累计】
cmdline:当前程序命令行完整调用路径
cmdline: The command line invocation of the current program【当前程序命令行的完整调用路径】
goroutine:当前程序所有goroutine堆栈信息,实时变化
goroutine: Stack traces of all current goroutines. Use debug=2 as a query parameter to export in the same format as an unrecovered panic.【当前所有运行的goroutine堆栈信息,实时变化】
heap:活动对象内存分配情况,实时变化
heap: A sampling of memory allocations of live objects. You can specify the gc GET parameter to run GC before taking the heap sample.【查看活动对象的内存分配情况,实时变化】
mutex:锁竞争记录,历史累计
mutex: Stack traces of holders of contended mutexes【导致互斥锁竞争持有者的堆栈跟踪,历史累计】
profile:cpu使用情况
profile: CPU profile. You can specify the duration in the seconds GET parameter. After you get the profile file, use the go tool pprof command to investigate the profile.【默认进行30s的CPU Profing,用于观察CPU使用情况】
threadcreate:新线程创建情况
threadcreate: Stack traces that led to the creation of new OS threads【查看创建新OS线程的堆栈跟踪信息】
trace:当前程序执行链路
trace: A trace of execution of the current program. You can specify the duration in the seconds GET parameter. After you get the trace file, use the go tool trace command to investigate the trace.【当前程序执行链路】
其他参数
flat:当前函数的数据,不含调用其他函数
以内存为例, flat:当前函数分配的内存,不包含它调用其他函数造成的内存分配
flat%:当前函数分配占比
例:flat%:当前函数分配内存占比
sum%:自己和前面所有的flat%累积值
cum:当前函数及当前函数调用其他函数分配总和
例: 当前函数及当前函数调用其他函数的分配内存的汇总
cum%:当前函数及当前函数调用其他函数分配总和占比
例:这个函数分配的内存,以及它调用其他函数分配的内存之和