目录
qDebug基本用法输出字符串输出变量值1输出变量值2支持流式输出输出十六进制去除双引号和空格调试输出级别 自定义类型输出自定义日志信息的输出格式示例占位符设置环境变量 关闭QDebug输出Qt工程VS工程 在VS工程中如何查看qDebug输出DebugView下载
qDebug基本用法
qDebug是Qt框架中用于输出调试信息的一个宏。它类似于C++标准库中的std::cout,用于在控制台中输出调试信息。qDebug的使用非常简单,可以用于输出各种类型的数据,例如字符串、整数、浮点数等。
输出字符串
qDebug() << "Hello, World!";输出变量值1
int num = 10;qDebug() << "num is: " << num;输出变量值2
QString name = "xiao";int age = 25;qDebug() << QString("Name: %1, Age: %2").arg(name).arg(age);支持流式输出
int num = 10;QString name = "xiao";qDebug() << "num is: " << num << ", name is: " << name;输出十六进制
int num = 80;qDebug() << QString("0x%1").arg(num, 8, 16, QChar('0')); //十六进制输出,8位,不够补0
去除双引号和空格
QString name = "xiao";QString age = "20";qDebug() << name << age; //输出带有双引号和空格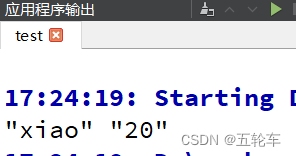
QString name = "xiao";QString age = "20";qDebug().noquote().nospace() //不带双引号和空格 << name << age;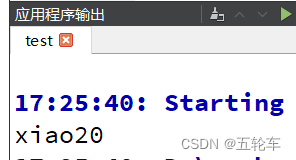
调试输出级别
qInfo、qWarning、qCritical等,用于输出不同级别的调试信息。
自定义类型输出
class Size {public: Size(int w, int h) { this->width = w; this->height = h; }//添加友员函数,可以在此函数中访问类中的所有成员 friend QDebug operator<<(QDebug dbg, const Size &size);private: int width; int height;};//实现输出运算符重载QDebug operator<<(QDebug dbg, const Size &size){ dbg.nospace() << "Size(" << size.width << "," << size.height << ")"; return dbg;}int main(int argc, char *argv[]){ Size size(1, 20); qDebug() << size; return 0;}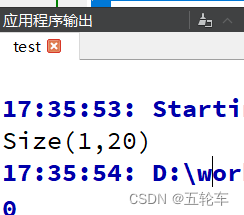
自定义日志信息的输出格式
qSetMessagePattern 是 Qt 提供的一个功能强大的函数,用于设置日志信息的输出格式和样式。它允许你自定义日志消息的显示方式,包括消息类型、时间戳、文件名、行号等。
通过 qSetMessagePattern 函数,你可以设置一个模式字符串,用于格式化日志消息。该模式字符串可以包含占位符,用于指示消息的不同部分。例如,你可以使用 %type 占位符表示消息类型,%time 占位符表示时间戳,%file 占位符表示文件名,%line 占位符表示行号等。
示例
int main(int argc, char *argv[]){ qSetMessagePattern("%{time yyyy-MM-dd hh:mm:ss.zzz} %{type} - %{message} %{file}:%{line}"); qDebug() << "hello world!"; return 0;}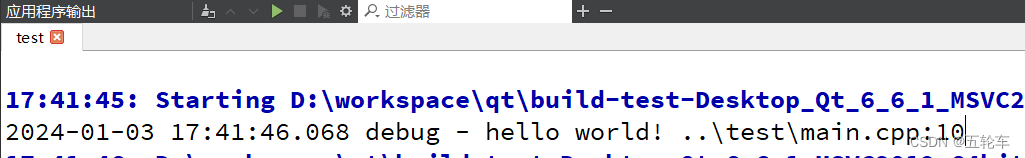
占位符
| 占位符 | 描述 |
|---|---|
| %{appname} | QCoreApplication::applicationName() |
| %{category} | Logging category |
| %{file} | Path to source file |
| %{function} | Function |
| %{line} | Line in source file |
| %{message} | The actual message |
| %{pid} | QCoreApplication::applicationPid() |
| %{threadid} | The system-wide ID of current thread (if it can be obtained) |
| %{qthreadptr} | A pointer to the current QThread (result of QThread::currentThread()) |
| %{type} | “debug”, “warning”, “critical” or “fatal” |
| %{time process} | time of the message, in seconds since the process started (the token “process” is literal) |
| %{time boot} | the time of the message, in seconds since the system boot if that can be determined (the token “boot” is literal). If the time since boot could not be obtained, the output is indeterminate (see QElapsedTimer::msecsSinceReference()). |
| %{time [format]} | system time when the message occurred, formatted by passing the format to QDateTime::toString(). If the format is not specified, the format of Qt::ISODate is used. |
| %{backtrace [depth=N] [separator=“…”]} | A backtrace with the number of frames specified by the optional depth parameter (defaults to 5), and separated by the optional separator parameter (defaults to “|”). This expansion is available only on some platforms (currently only platfoms using glibc). Names are only known for exported functions. If you want to see the name of every function in your application, use QMAKE_LFLAGS += -rdynamic. When reading backtraces, take into account that frames might be missing due to inlining or tail call optimization. |
设置环境变量
可以修改环境变量QT_MESSAGE_PATTERN来修改输出格式,如果调用了qSetMessagePattern函数并设置了QT_MESSAGE_PATTERN,则环境变量优先。
关闭QDebug输出
Qt工程
在Qt工程文件(xxxxx.pro)里面添加
DEFINES += QT_NO_DEBUG_OUTPUT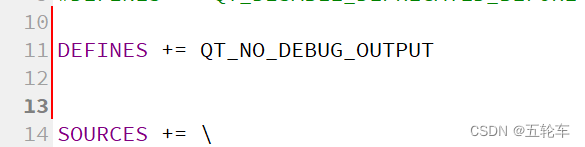
VS工程
vs工程=>右键“属性”=>“C/C++”=>“预处理器”=>“预处理器定义”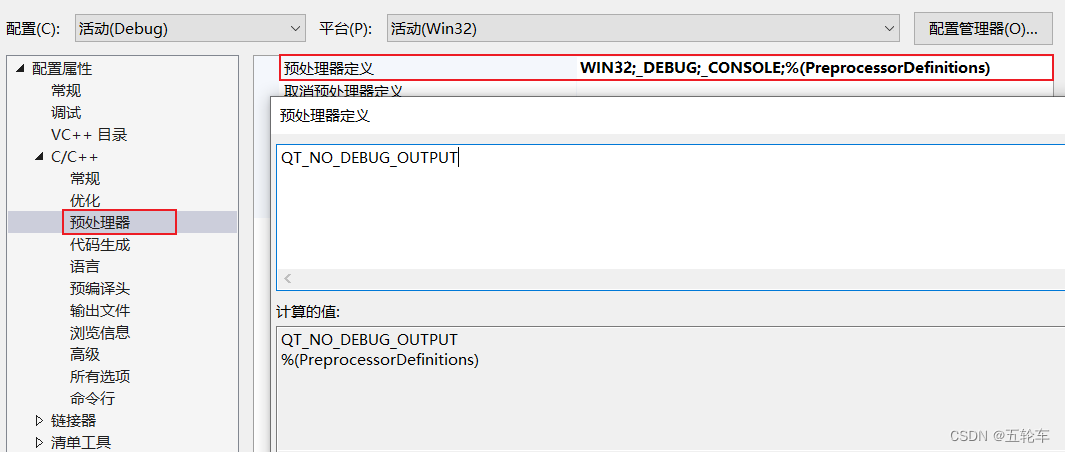
在VS工程中如何查看qDebug输出
DebugView下载
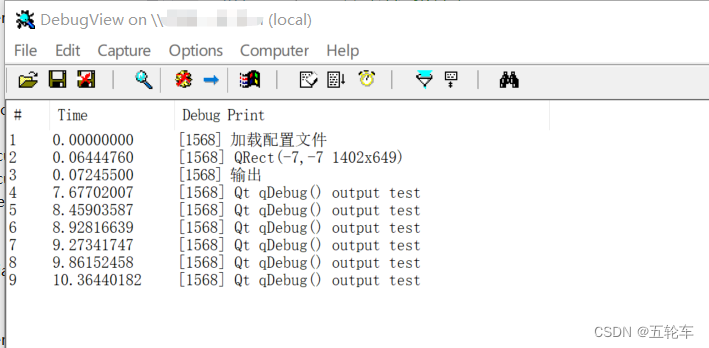
如果您在Visual Studio工程中使用qDebug觉得不便,我为您推荐一款能够即时查看qDebug输出的实用工具——DebugView。
DebugView是一款专门用于捕获调试信息的工具,尤其适用于处理qDebug的输出。它能够在您运行Qt应用程序时,即时、动态地捕获并显示qDebug的日志信息。这意味着,无论您在代码中的哪个位置使用qDebug进行调试输出,DebugView都能为您捕捉并呈现这些信息,让您轻松跟踪程序的执行流程。
使用DebugView查看qDebug输出的步骤相当简单:
首先,启动DebugView工具。随后,运行您的Qt应用程序。当您的程序通过qDebug输出调试信息时,这些信息将会被DebugView实时捕获并展示在界面上。借助DebugView的帮助,您将能够更轻松地在Visual Studio工程中管理和调试Qt应用程序。这款工具不仅限于qDebug的查看,它还提供了更多高级功能,帮助您更好地理解和调试您的程序。
DebugView下载